Bar Chart Report Item
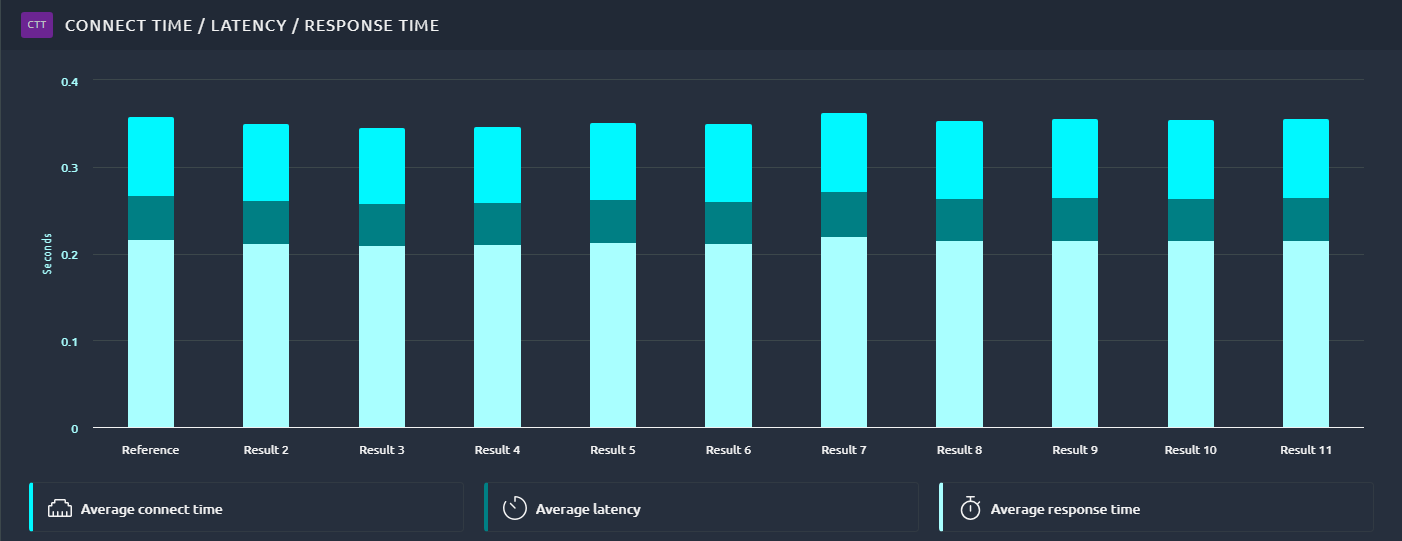
Bar charts show the evolution of metrics over the course of several tests:
Configuration
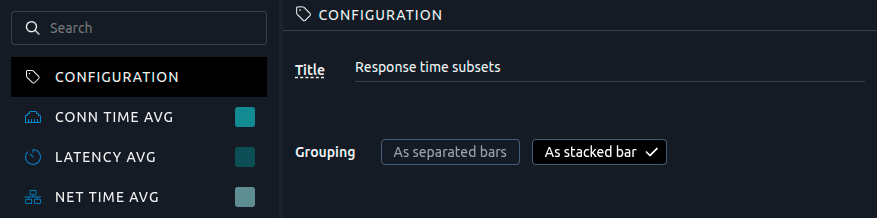
Grouping car be set to As stacked bar or As separated bar:
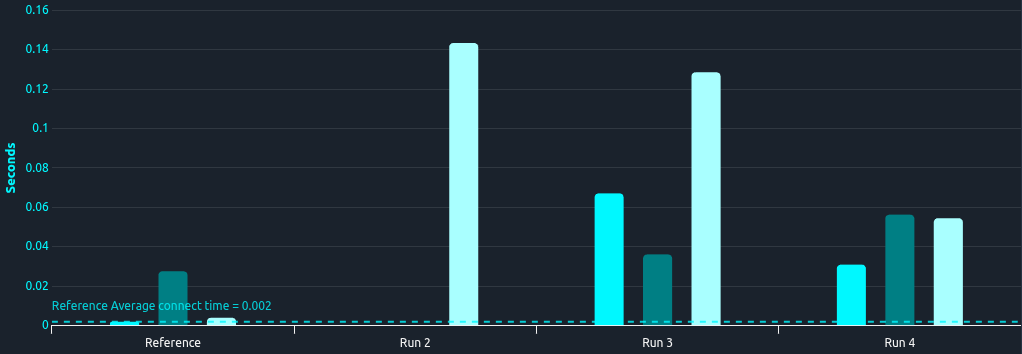
Several metrics are available, please report to the Hit Metrics Availability tables.
Note
This report item is only available from inside a Trend report.
Axes
The Axes section of the Configuration panel lets you switch an axis from linear to logarithmic scale. This keeps bars of very different heights readable in the same chart.
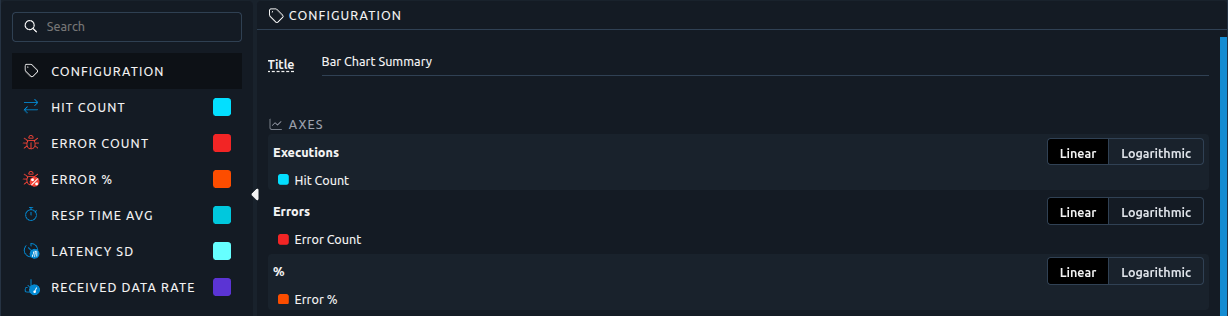
Bar charts support the scale setting only: a metric cannot be detached to an axis of its own, because a series of bars can combine several metrics.
Warning
When the bars are grouped As stacked bar, the axes cannot be customized. The Axes section says so.
Refer to the Axes documentation for details.
Export
To export the chart please refer to the dedicated documentation page.