Test status
flowchart LR
created(Created)
pending(Pending)
scaling(Scaling)
preparing(Preparing)
initializing(Initializing)
error[<span style="color: red"><b>Error</b></span>]
running(Running)
finished[<a href="#test-finished"><b>Finished</b></a>]
aborted[<a href="#test-aborted" style="color: orange"><b>Aborted</b></a>]

created --> pending
pending --> scaling
scaling --> preparing
preparing --> initializing
initializing --> error
initializing --> running
running --> finished
running --> aborted
On this page we explore the various status a test can have:
- CREATED: The test has been created.
- PENDING: The test has not been processed yet. It's waiting to be taken in charge by the batch processes.
- SCALING: Machines are being provisioned when more are needed.
- PREPARING: Pulling Docker images, creating and starting containers.
- INITIALIZING: Containers are initializing themselves. Resources and plugins are transferred to each one of them during this stage.
- ERROR: Machines could not be provisioned. Happens when using on-premise providers with not enough machines.
- RUNNING: The load generators have joined the test and are up and running.
- FINISHED: The schedule execution is finished.
- ABORTED: The schedule has been cancelled.
Test finished
A finished test in OctoPerf can have two states FINISHED or ABORTED.
FINISHED indicates the test was stopped as planned before its execution, but since there are many such mechanisms that can be sometimes confusing.
ABORTED on the other hand indicates that it was stopped from an external source, but the nature of this source can vary depending on the context.
We will rely on OctoPerf reports and JMeter logs analysis to figure out which one was the trigger. JMeter logs can be found in the test logs menu.
End of duration
The normal state is FINISHED and it happens most of the time because the test has reached the end of its duration.
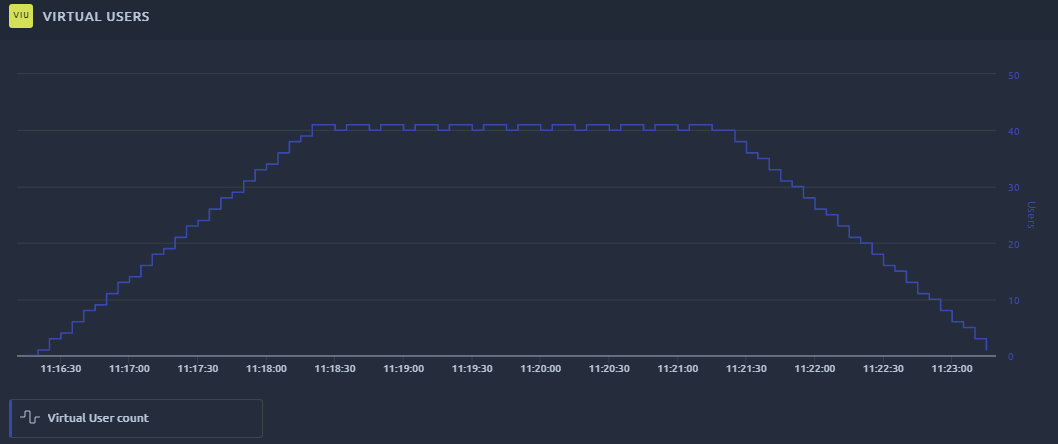
The best way to tell is to look at the UserLoad line chart that is displaying active users.
It should look exactly like the one you configured on the runtime screen in terms of number and duration.
No more users running
Another reason for a test to stop is the absence of any virtual users running. It means they have all reached their planned number of iterations before the end of the test duration. This typically happens when you limit the number of iterations on the runtime screen.
For a 100 users test with 5 minute ramp up, the userload curve might look like this:
 Users are stopping because they've finished their iterations, others are ramping up to compensate for a while, and then when the ramp up is finihed the remaining users quickly stop as well.
In the JMeter logs you would see all the thread stopping before the duration with this message:
2020-01-27 08:09:40,166 INFO o.a.j.t.JMeterThread: Thread finished: dyEM5m8BfG-429z8OsUM 1-1
Test stopping events
CSV
A CSV was configured to stop the virtual users when it is out of values. Because of that all virtual users using it stop their iterations, after a while, all the users/threads are stopped. It's easy to identify since in the logs you would find a message like this one:
2020-01-27 08:14:56,500 INFO o.a.j.t.JMeterThread: Stop Thread seen for thread WGoR5m8BlhUq-QGDEIdg 1-1,
reason: org.apache.jorphan.util.JMeterStopThreadException: End of file:resources/credentials.csv detected
for CSV DataSet:login configured with stopThread:true, recycle:false
Sample error policy
On the runtime screen, the On Sample Error policy was configured on Stop VU or Stop test and at least one sample had an error. This one is easy to spot as well since in the logs you would see a message like this one:
2020-01-27 08:09:40,161 INFO o.a.j.t.JMeterThread: Shutdown Test detected by thread: dyEM5m8BfG-429z8OsUM 1-1
Thread finished
Another possibility is that the current thread has a timer or delay that would make it wait until the end of the test, in that case you might see threads switching to finished , sometimes even right when they get started:
2020-10-09 20:14:02,181 INFO o.a.j.t.JMeterThread: Thread started: PyDlDnUBxfxBFVqd-_qL 1-392
2020-10-09 20:14:04,541 INFO o.a.j.t.JMeterThread: Thread finished: PyDlDnUBxfxBFVqd-_qL 1-392
2020-10-09 20:14:05,520 INFO o.a.j.t.JMeterThread: Thread started: PyDlDnUBxfxBFVqd-_qL 1-393
2020-10-09 20:14:07,918 INFO o.a.j.t.JMeterThread: Thread finished: PyDlDnUBxfxBFVqd-_qL 1-393
2020-10-09 20:14:08,860 INFO o.a.j.t.JMeterThread: Thread started: PyDlDnUBxfxBFVqd-_qL 1-394
2020-10-09 20:14:12,199 INFO o.a.j.t.JMeterThread: Thread started: PyDlDnUBxfxBFVqd-_qL 1-395
2020-10-09 20:14:13,139 INFO o.a.j.t.JMeterThread: Thread finished: PyDlDnUBxfxBFVqd-_qL 1-15
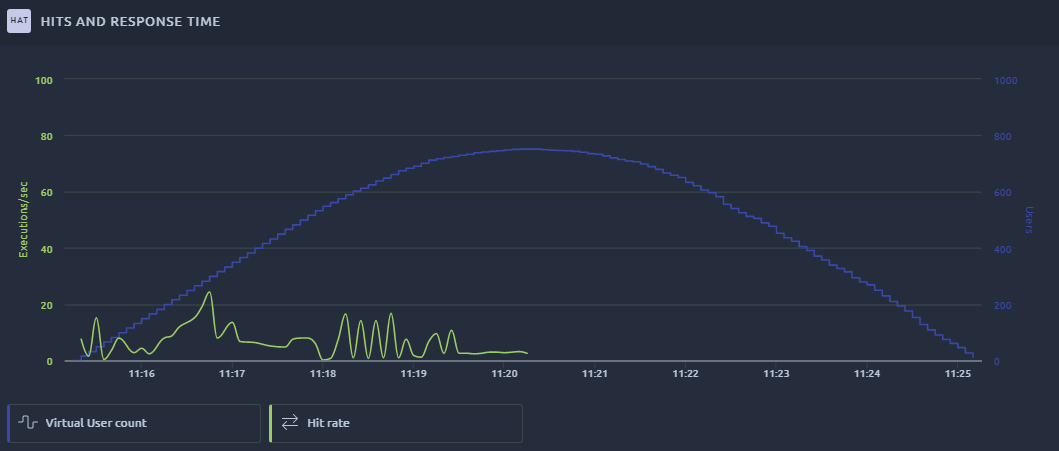
Here is an example of such behavior, this test was supposed to ramp up to 1000 users in 5 minutes. But with a think time of 2.5 to 7.5 minutes, threads begin to stop when there's less than 7.5 minutes of test remaining, and the closer we get to the end, the faster the threads stopping rate gets:

Note
This behavior is not an issue since the threads would not have done anything anyway, it's just a way to limit the memory footprint of the test.
Test aborted
Manual abort
In case the test was manually aborted, the latest versions of OctoPerf will log the username that aborted the test in the standard log like this:
2020-01-27, 10:15:51 INFO Test status changed: PREPARING => INITIALIZING
2020-01-27, 10:16:07 INFO Test status changed: INITIALIZING => RUNNING
2020-01-27, 10:16:17 INFO demo@octoperf.com aborted the test
2020-01-27, 10:16:17 INFO Test status changed: RUNNING => ABORTED
Batch aborting unresponsive test
When we send the test stopping message to all load generators, they forward it to each one of their users/threads. If the threads are too busy doing something else, they may miss this message. Typically loops, scripts and waiting for long responses or timeouts can explain this behavior.
Since we cannot forcefully stop the load generator right away, we allow them 20 minutes to finish what they're doing. The best way to identify this is to check the test log:
00:01:55 INFO [TestStatusChanged] SCALING => PREPARING
00:01:59 INFO [TestStatusChanged] PREPARING => INITIALIZING
00:03:58 INFO [TestStatusChanged] INITIALIZING => RUNNING
04:39:03 INFO [TestStatusChanged] RUNNING => ABORTED
04:39:03 WARN Aborting stall test (expected end time:2024-02-02T03:38:58.889Z is past now)
Load generator aborted
If a load generator is aborted during your test the only message you will see in the logs is this one:
2020-01-20 17:30:13,081 INFO o.a.j.JMeter: Command: Shutdown received from /127.0.0.1
So when all the other explanations do not correspond to your situation you can assume that was the case. That means the docker container running the tests received a shutdown command and thus the last message he was able to forward in the logs is this one. It can either be because you are using an on premise agent that was shut down, or someone removed your JMeter container while the test was running.
Note
This does not happen on the cloud platform since we do not operate on agents that are being used by our customers. If you think you encountered a load generator shutdown, please first check the other possibilities.