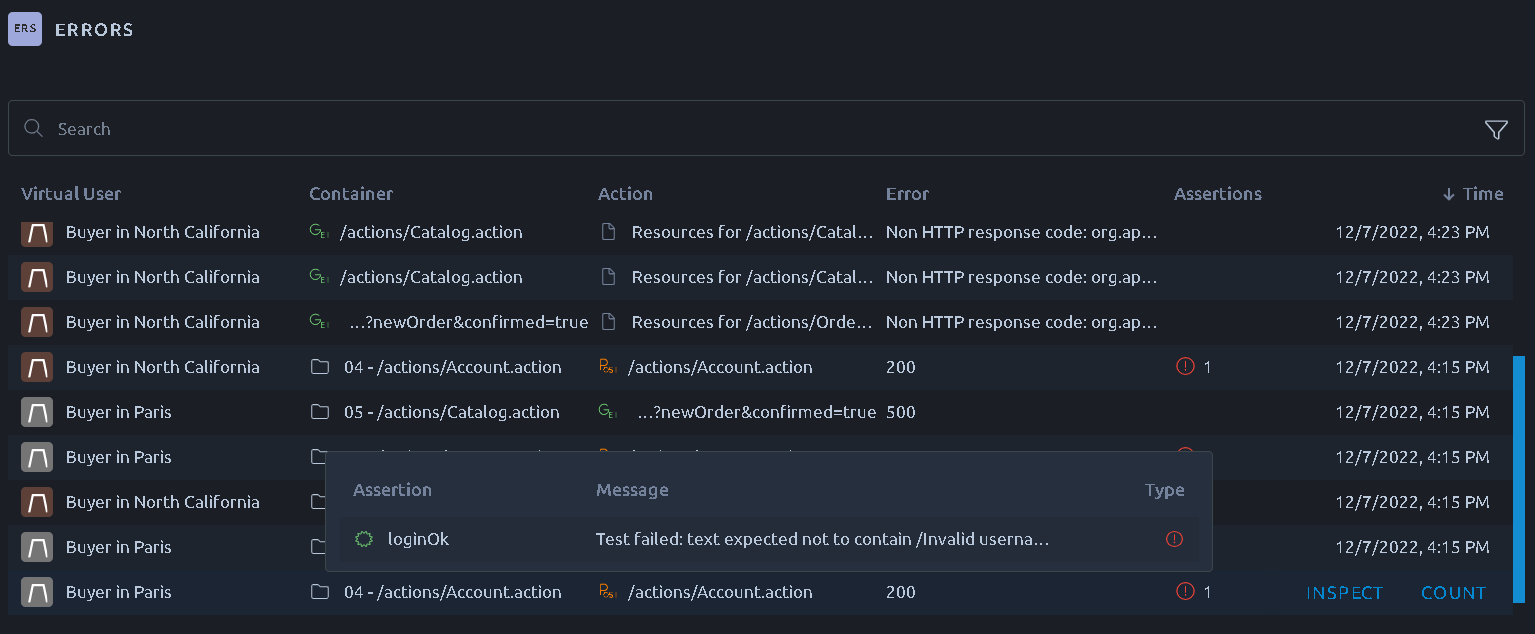
Errors Table Report Item
The errors table provide details about each error which occurred during the test. It allows to understand what happened server-side during the load test.

| Name | Description |
|---|---|
| Virtual user | The name of the Runtime profile or by default Virtual user + region |
| Container | Parent container or request |
| Action | Request (or sampler) that failed |
| Error | Error message |
| Assertions | Assertions failed on this request/sampler |
| Time | Time of the error converted in your browser local time. |
Configuration
To customize the Errors Table, please refer to the documentation page about the legend and metrics. Only location and virtual user can be used as filters.

Warning
To improve readability, on the SaaS platform the table only displays 2 errors per (load generator + request + error code). You can change this behavior in the settings of your on premise platforms.
Export
To export the table please refer to the dedicated documentation page.
Error details
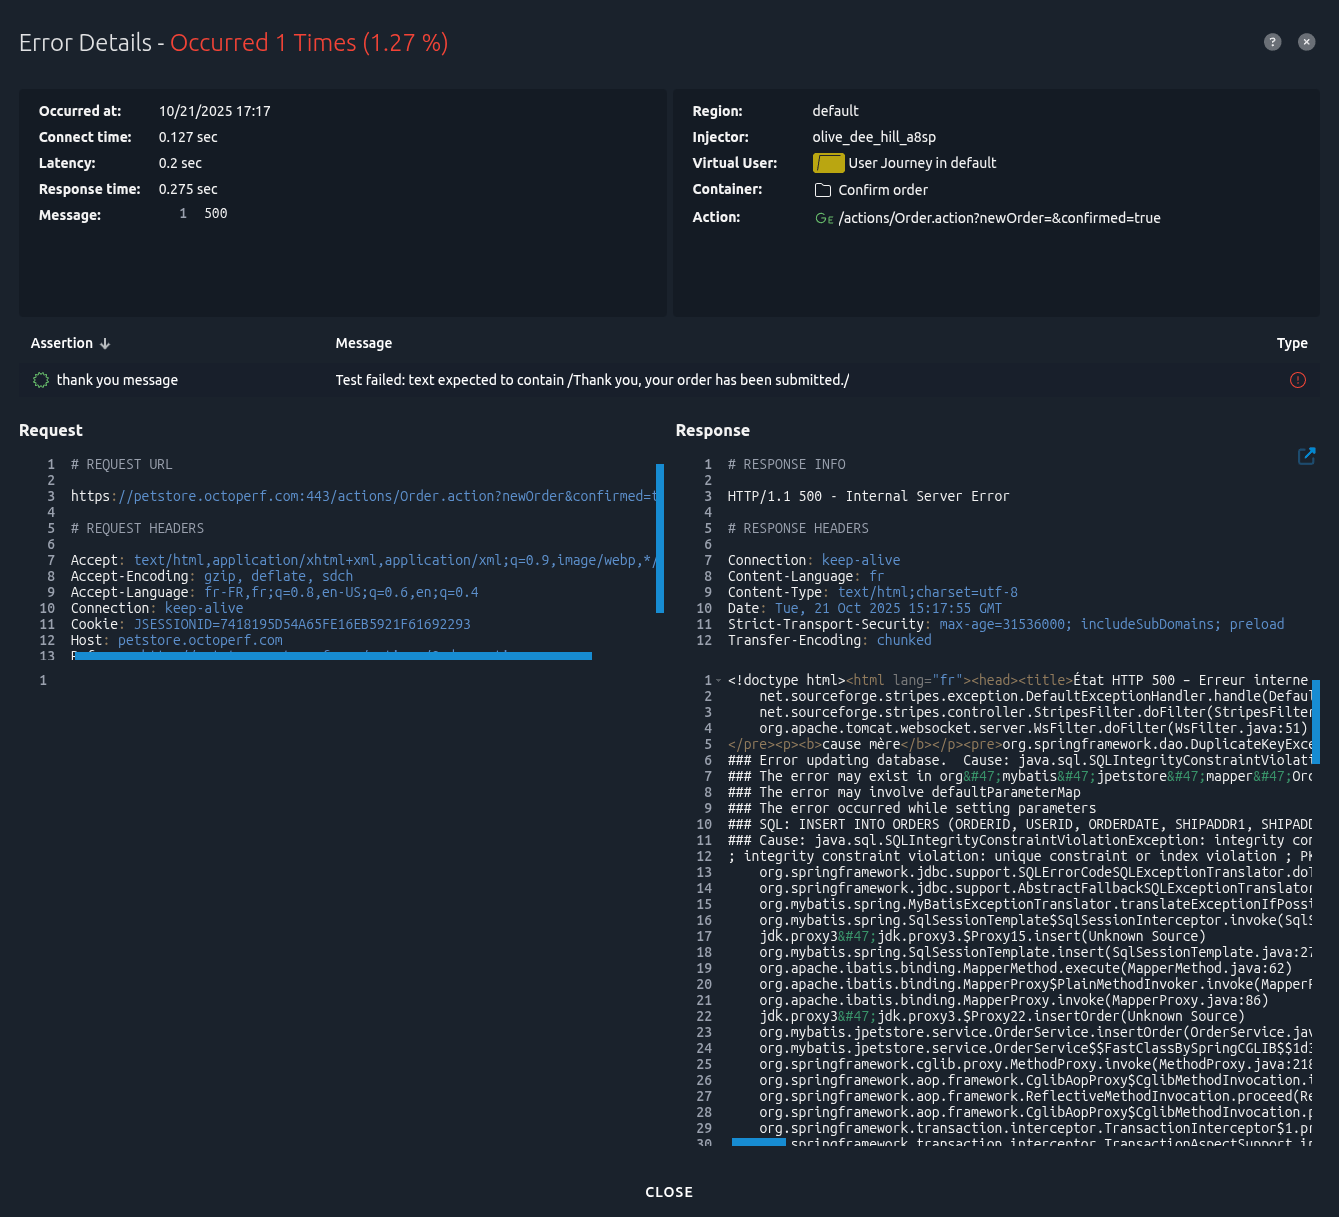
Click on Inspect Errors to display detailed information:
- Number of errors: the number (and percentage) of this error message compared to the total hits on this request,
- Occurred at: the exact time at which the error occurred,
- Timings of this particular request,
- Message: the error message or code,
- Region: in which region the error has occurred,
- Injector: load generator container name,
- Virtual user: which user profile and associated virtual users raised the error,
- Container: the parent container of the action that failed,
- Action: action which failed,
An additional table displays the potential assertions that failed for the request.
And the Request and Response panels displays the request which has been sent to the server, and the received response.

Info
You can search inside headers or bodies using the same functions as the code editor available throughout OctoPerf.
Error count
Click on Count Errors to display the number of error occurrences and their percentage in the upper right corner of the application:

Understanding errors
Failure criterias
An error is triggered when:
- The response code is
4XXor5XX, - There is no response code (JMeter internal error message),
- An assertion failed.
If you compare this to the virtual user validation, we are in the same situation than when there is no recorded content to compare the response with.
Displayed errors
To avoid overloading our reporting interface, we only store up to 2 errors for each combination of:
- Load generator
- Request
- Response code
This way if a particular requests encounters two different response codes during the same test, you would see at least one of each in the Error table. While maintaining a manageable size for the error table at the same time.
4XX and 5XX codes
These codes can mean one of two things:
- The application is failing,
- The test scripts are incorrect.
Now to understand which one you are facing takes some analysis, using assertions can help pinpoint the failure accurately. Since we only display the requests that failed, assertions are a good way to make sure you provoke the failure at the right place. For instance, you could see an issue with a payment in the error table when in fact it's your login that failed earlier.
No response codes
When there is no response code, JMeter will output the error message in the response body. In OctoPerf we typically show a response header like this:
HTTP/1.1 -1 - UNKNOWN
Now this can mean several things, it could be an issue with your scripts, for instance if a variable fails to be evaluated in the path, you might get something like this:
java.net.URISyntaxException: Illegal character in path at index 39: https://petstore.octoperf.com/actions/${path}
But most of the time it is just related to the server not answering our requests. Because of this JMeter has no response code to display and it show an error message instead.
Network errors
When the application becomes hard to reach or even completely unreachable during the test, you might experience one of these response messages:
javax.net.ssl.SSLException: Connection resetjavax.net.ssl.SSLException: Socket closedjava.net.SocketTimeoutException: Read timed outjavax.net.ssl.SSLHandshakeException: Remote host terminated the handshakeorg.apache.http.NoHttpResponseException: XXXXX failed to respondorg.apache.http.conn.HttpHostConnectException: Connect to XXXXX failed: Connection timed out
All of these indicate that the remote server was either not answering or rejected our request. We take action to prevent such errors to occur because of our load generators. If the threshold table is empty, then look for issues on the network path between our agents and your servers.
To mitigate these issues, you can also try to increase the number of retries by editing properties.
Warning
We do not recommend doing this since network issues indicate bottlenecks that should be analyzed.
Routing errors
When the load generator cannot find a path to the application, you will face a message like this one:
java.net.NoRouteToHostException: No route to host
This indicates that your application requires whitelisting to be accessed, try whitelisting the IP range of a particular AWS location or get in touch with OctoPerf sales team to purchase a dedicated IP.