Monitoring Connection
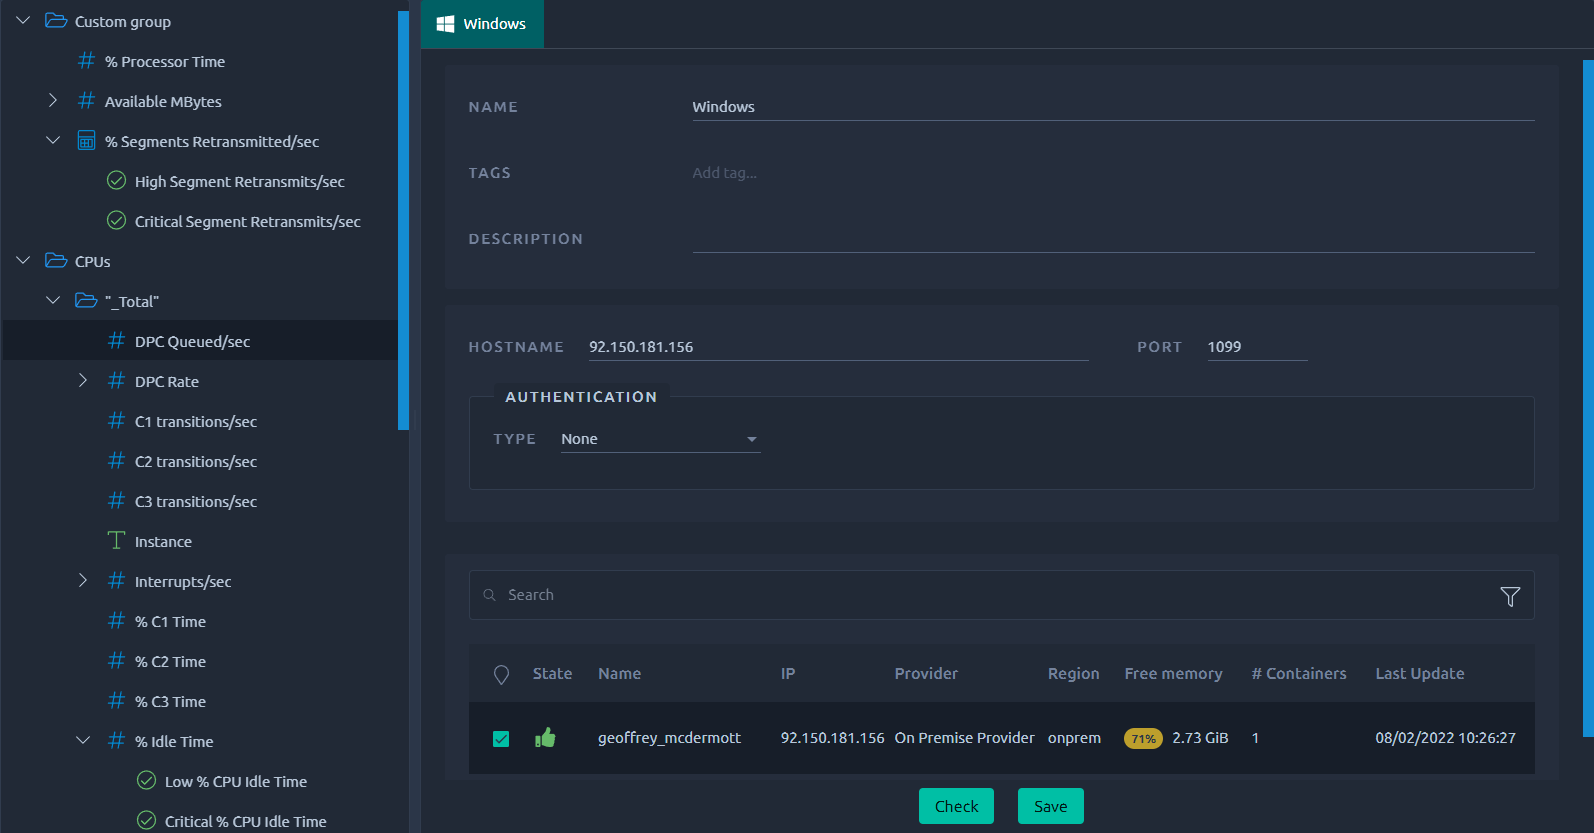
Once a monitoring connection has been created, it can be edited. By clicking on the monitoring connection it opens the edition panel. This panel is analog to the virtual user design page.

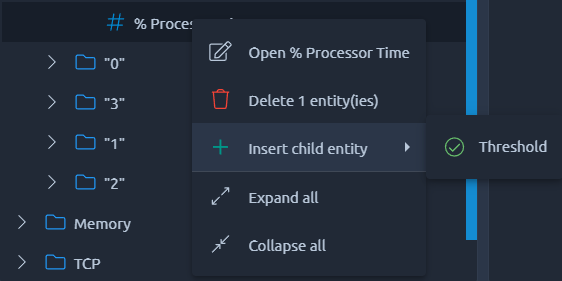
You can use the right click menu in the tree for contextual actions, similarly to the tree in the design screen.
The right panel allows you to update the monitoring metadatas, configuration and agent with new values.
Tip
If you're making meaningful changes like different credentials or selecting another agent, make sure to use the Check button to validate your changes before leaving this page.
Custom Group

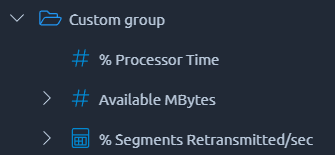
Custom groups of metrics can be created to regroup relevant counters together. This allows for a better readability in the report since you'll be able to filter/select them faster.
Thresholds

Threshold are conditions on collected counter values and time. When the counter value reaches a threshold range, an alert is raised. For more information, see thresholds.