Area Chart Item

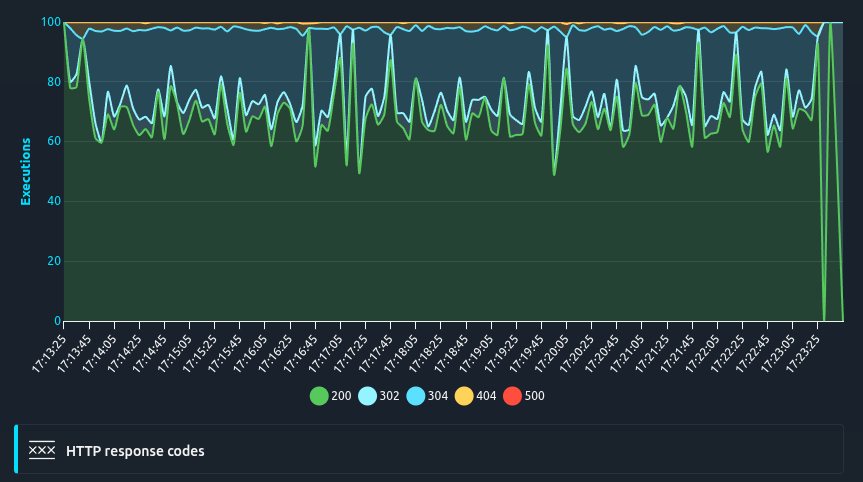
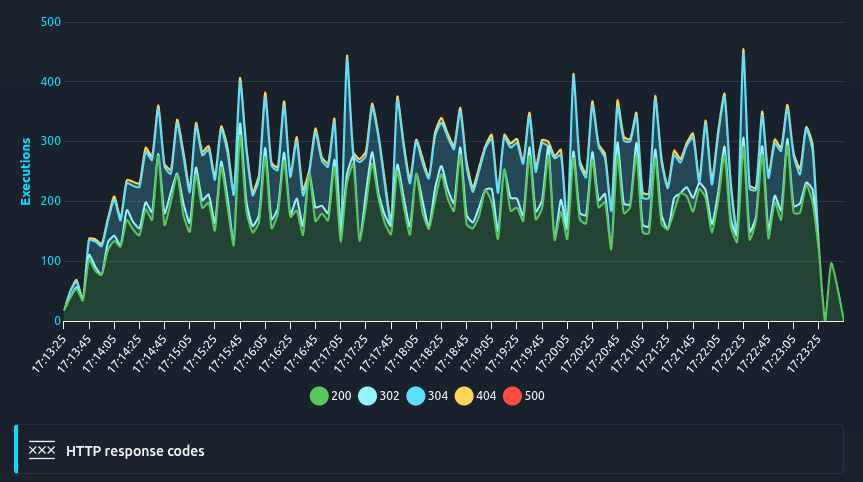
Area charts are useful to get a quick overview of HTTP Response code, HTTP methods and HTTP response media types distribution over time. It allows to quickly spot if the web applications is running as expected.
Configuration
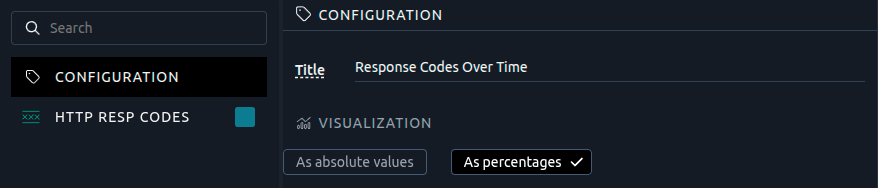
You can change the mode between Absolute and Percent (default value) by clicking on the toggle button in the Configuration settings tab.
Several metrics are available, please report to the Donut Chart Metrics Availability table.
Note
To customize the Area Chart metric, please refer to the documentation page about the legend and metrics. You can only have one metric per area chart.
Export
To export the chart please refer to the dedicated documentation page.