Results Tree Report Item
The results tree provides overall statistics for each container or request in the form of a tree.
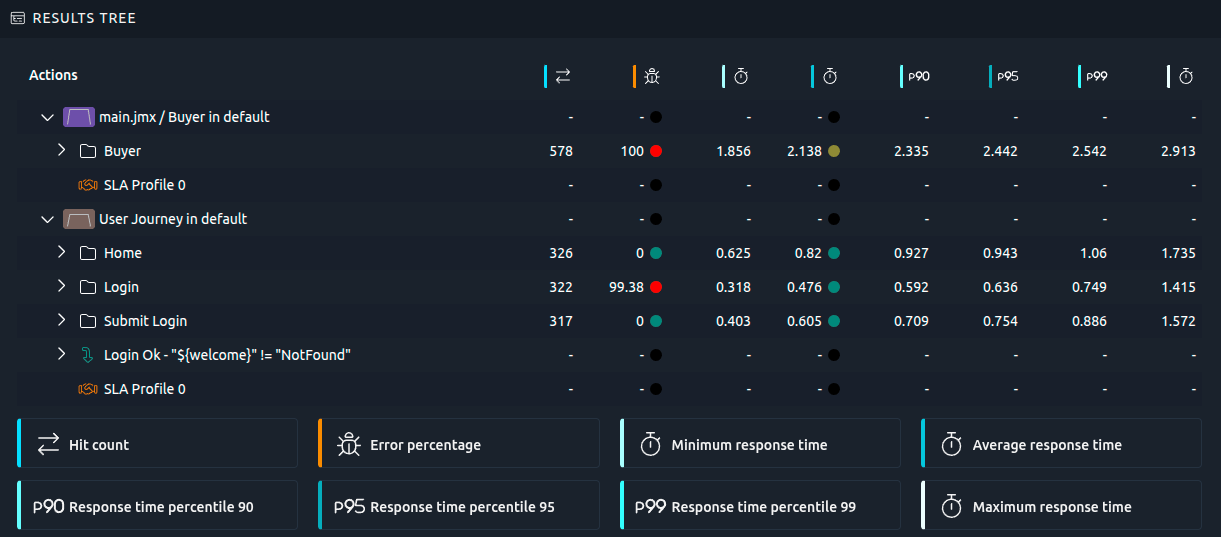
Several metrics are available, please report to the Hit Metrics Availability tree.
Note
To customize a specific column, please refer to the documentation page about the legend and metrics.
Info
When displaying statistics for HTTP requests, you may have two rows for each request if you selected Download Resources in your Virtual User.
- A row that displays statistics for the HTTP request itself:

- A row that displays statistics for all the HTTP request resources (Images, scripts, CSS files, etc.):

Virtual Users and user profiles
The tree holds one root per Virtual User, whatever the number of user profiles that play it in your scenario. A Virtual User your scenario runs from ten different locations therefore appears once, and the statistics of its rows cover the whole run.
A Virtual User that also runs as a Set Up or Tear Down phase gets its own root, so what happened before and after the main load never gets mixed with it.
To look at a single user profile, add a User Profile filter to the item from the metrics selection page. The values it offers are the user profiles of the scenario, in the order they appear in it.
Export
To export the table please refer to the dedicated documentation page.
Playwright
When working with Playwright virtual users, the tree is slightly different, with two main groups:
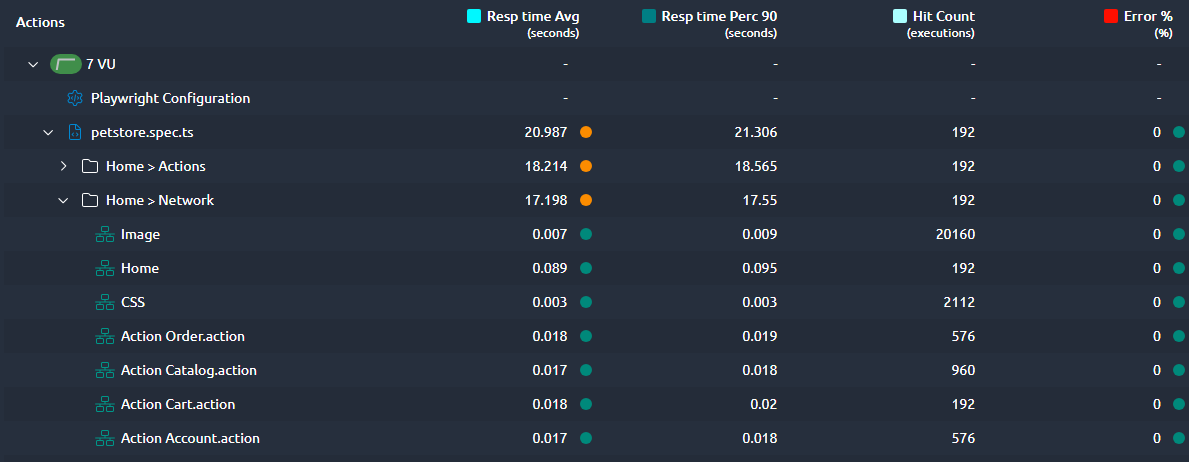
Actions: List of all the actions performed inside the Playwright script along with their response time.
Network: A measure of the response time of the actual requests performed by your playwright browser. They can be grouped using Aggregators from inside your playwright virtual user.
Known limitations
When a Think Time (slowMo) is used, the response times may display negative values in some corner cases:
- Using discouraged Playwright API like waitForTimeout,
- Using actions inside nested
forandifinstructions.