Percentiles Chart Item
A percentile indicates the maximum value for a given percentage of metrics. A well known percentile is the median which is equivalent to the 50 percentile.
Percentiles charts shows the value of all percentiles that are a multiple of 5:
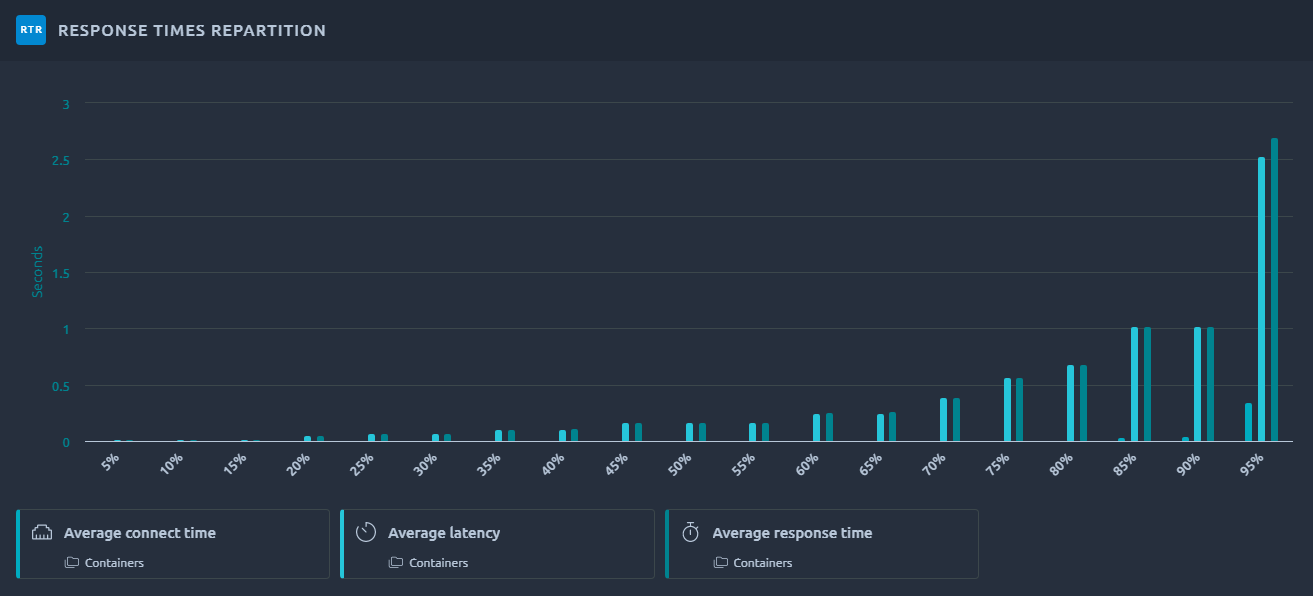
Several metrics are available, please report to the Hit Metrics Availability table.
Note
To customize a specific metric, please refer to the documentation page about the legend and metrics.
Axes
When the metrics of a percentiles chart have very different magnitudes, for example the connect time and the response time, you can keep them readable in a single chart from the Y axes box of the item Configuration panel:
- Logarithmic scale: an axis can switch from linear to logarithmic, for all the metrics it carries.
- Dedicated axis: a metric can be detached to an axis of its own, which fits the values of that metric.
Refer to the Y axes documentation for details.
Export
To export the chart please refer to the dedicated documentation page.