Threshold usage
Monitoring an infrastructure with several servers can quickly come up with dozen of counter metrics being collected. It can become tedious to find which metrics are off the line.
By defining thresholds on key counters, the user can focus on counters which are raising alarms. Instead of having to check every single counter metric manually, the alerting system raises an alarm when a counter metric goes above defined thresholds.
Threshold alerts are shown live during the load test to allow the user to quickly pinpoint issues.
Thresholds
Understanding Thresholds
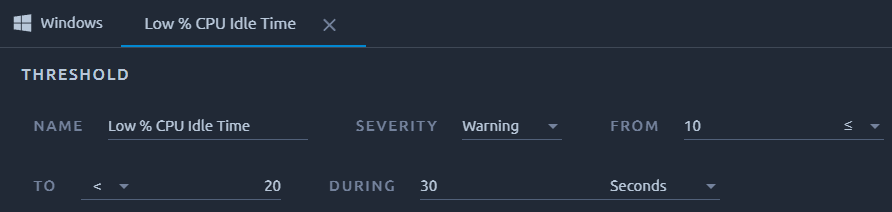
A Threshold is the conjunction of several conditions which raise an alarm. It's defined several factors:
- Name: Display name of this threshold,
- Severity: either WARNING or CRITICAL, the severity defines the criticality level,
- From/To: defines the range the counter value has to reach. It can be a closed or an open range,
- During: defines the amount of time required. The Condition must be met at least for that duration in order to raise an alarm.
Example
Raise a WARNING when % CPU Idle Time is less than 20% during more than 30 seconds.
Adding a Threshold
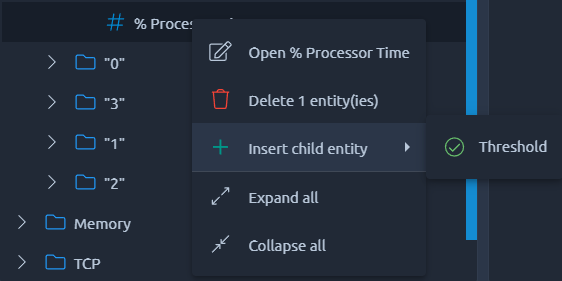
To add a threshold simply right-click in the monitor tree and add a threshold as a child.
Threshold Alarms
Understanding Alarms
Alarms are available in Analysis reports. An alarm is raised during the load test when a counter metric meets its threshold conditions. Alarms are available in the following report items:
- Line charts,
- And Threshold Alarms table.
Next sections are detailing each of the report items available.
Line charts

Thresholds and alarms associated to a counter are displayed directly in the line chart:
- Thresholds are drawn as horizontal lines. Line label reminds the threshold condition,
- Alarms are drawn as vertical lines and bands, depending on the alarm duration.
Threshold alarms are updated in real-time when the test is running. Line chart monitoring curves can be selected individually and customized.

First, a monitor connection must be selected. Then, the counter to graph must be selected in the counters tree.
Threshold Alarms table

The Threshold alarms table lists all the alarms which occurred since the beginning of the test:
- Time: the date when the alarm started,
- Duration: the duration during which the alarm was active,
- Connection: the monitor connection related to the alarm,
- Counter: the counter whose threshold has raised the alarm,
- Threshold: the threshold associated to the alarm.
Like line charts, this table can be filtered to display alerts occurring only for all counters of a given connection, or for a specific counter.