Server Monitoring
Monitoring the infrastructure while running a load tests provides invaluable information about what's happening server side. Understanding which requests are slow is only part of the answer. Monitoring provides the missing part: understanding which part of the infrastructure (Web server, Database, Operating System..) is the bottleneck.
Octoperf supports monitoring a variety of web servers, application servers, databases, operating systems and more. Correlate load testing metrics like response times with backend monitoring metrics like CPU usage in the same report.
How it works


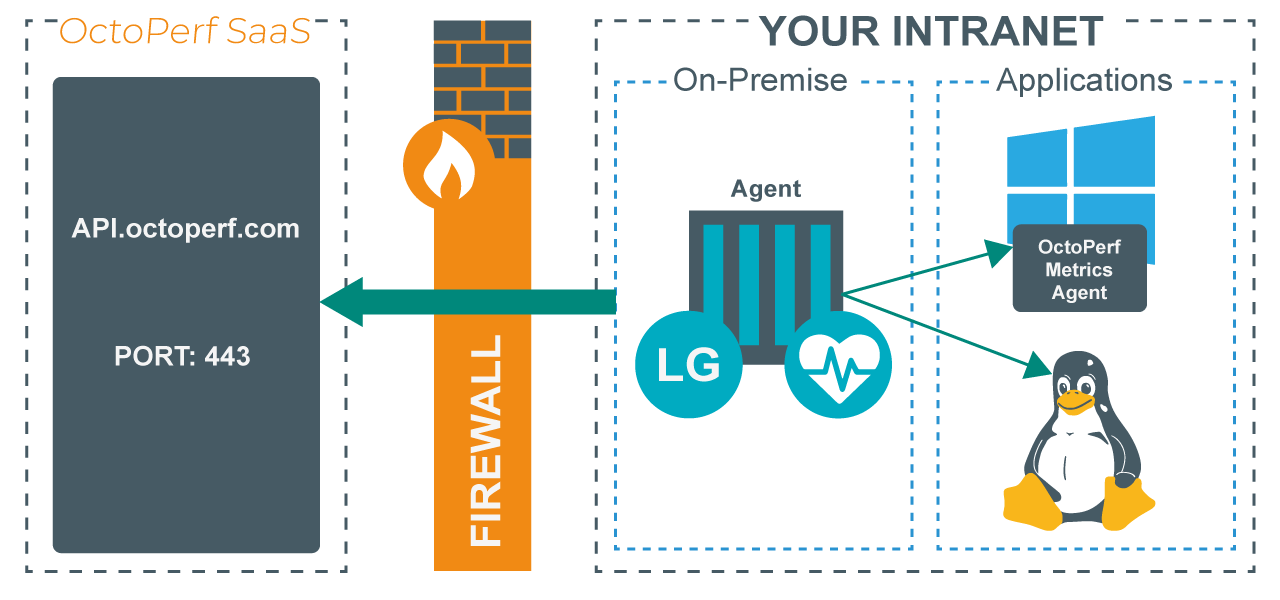
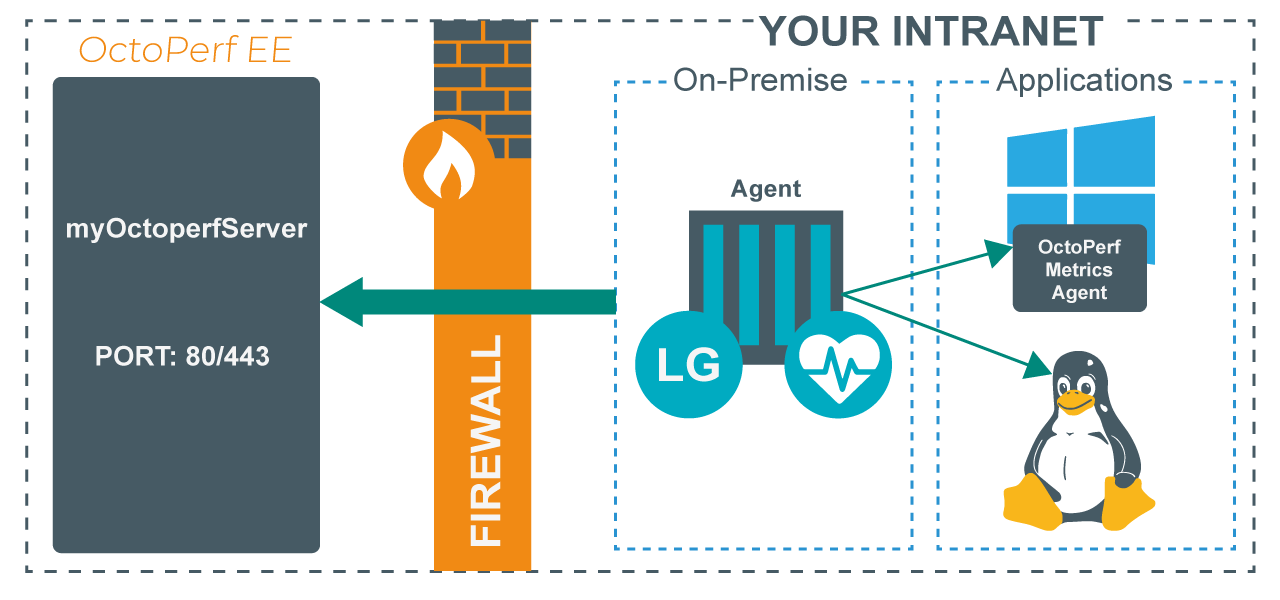
The monitoring agent runs on an On-Premise Agent. The monitoring agent is basically a docker container which makes regular requests to OctoPerf. The monitoring agent contains everything to monitor web servers, application servers, operating systems and more.
The agent performs only outgoing requests to our platform. This configuration passes through firewalls in most cases. The monitoring agent automatically starts and stops monitoring servers when running load tests.
Overview of prerequisites
Since we use existing components, each technology has its own prerequisites. Here is a summary table, but each more details are available on the dedicated page of each monitor:
| Monitoring | Protocol | Default port | Other |
|---|---|---|---|
| Generic JMX | TCP (JMX) | 9004 | Activate remote JMX on JVM |
| Apache HTTPD | HTTP/S | 80/443 | Activate mod status |
| Apache tomcat | TCP (JMX) | 9004 | Activate remote JMX on JVM |
| Lighttpd | HTTP/S | 80/443 | Activate mod status |
| NGINX | HTTP/S | 80/443 | Activate mod status |
| MongoDB | TCP | 27017 | Login/password |
| MySQL | TCP (JDBC) | 3306 | Login/password |
| Oracle | TCP (JDBC) | 1521 | Login/password |
| PostgreSQL | TCP (JDBC) | 5432 | Login/password |
| Linux | SSH | 22 | Login/password |
| Windows | TCP (JMX) | 1099 | Metrics agent |
| IIS | TCP (JMX) | 1099 | Metrics agent |
| SQL Server | TCP (JMX) | 1099 | Metrics agent |
| Prometheus | HTTP/S | 80/443 | |
| New relic | HTTPS | 443 |
Real Time Monitoring
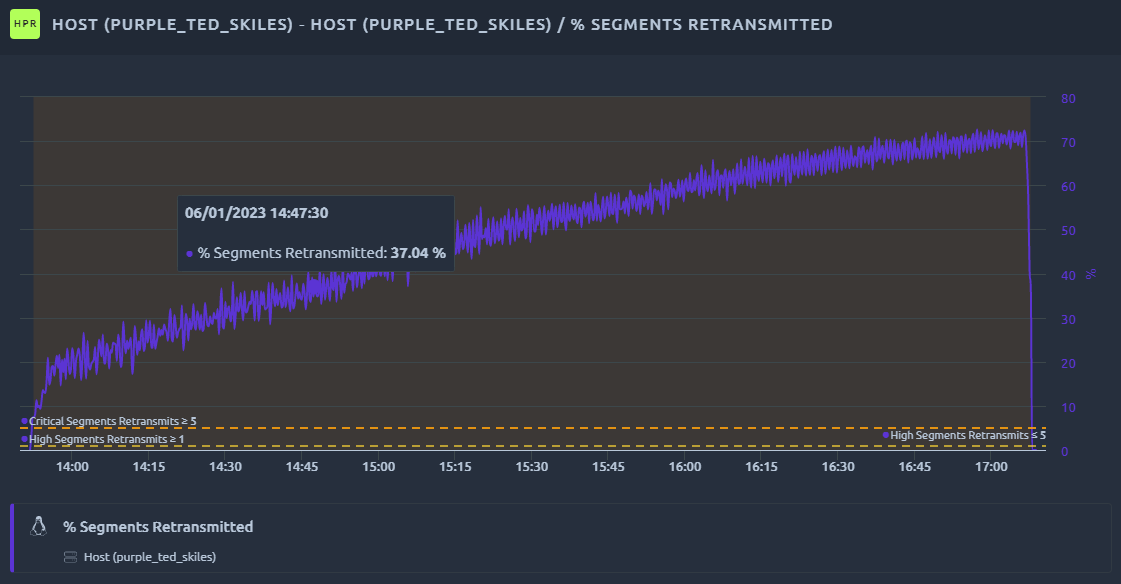
Monitored counter metrics and threshold alarms are available in real-time during the load test. Knowing server-side performance issues as they occur saves time.

Line chart showing % Busy workers and associated threshold alarms raised during the test.