Debug panel
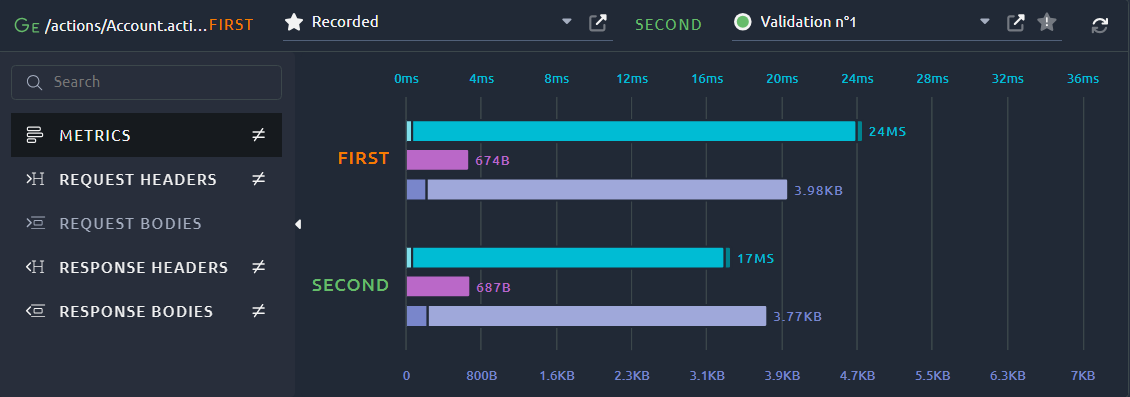
The debug panel allows you to view the requests and responses played during the record of the Virtual User and during a Validate VU.
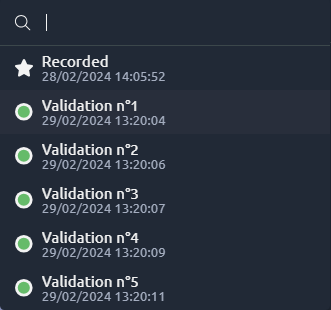
You can use the LEFT and RIGHT drop down lists to select an occurrence. When a different occurrence is selected in each of these lists, the Debug panel will switch to Comparison mode.
To revert back to the Detailed mode, just select the same occurrence in both FIRST and SECOND lists.
Tip
If you create a Virtual User by hand (without importing a HAR), recorded requests and responses are not present. You may run a validation to get requests / responses.
| Icon | Action | Description |
|---|---|---|
 |
Save as recorded | This action will overwrite the recorded response with the new one. Be careful, it cannot be undone. |
 |
Open in a new tab | Sends the response content in a new browser tab to attempt rendering it. |
Timings
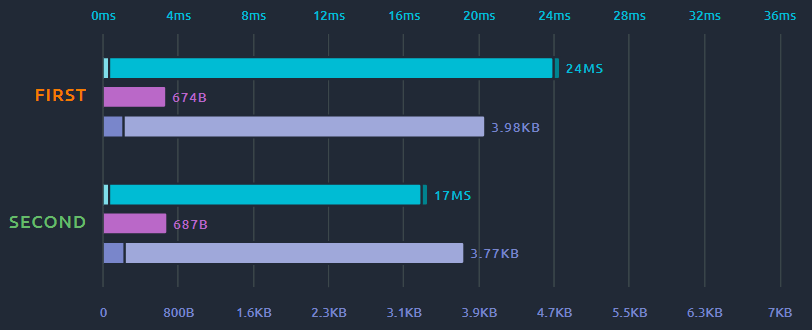
In this section you can see various metrics regarding the requests. Hover your mouse on one of the bars to see the nature of this metric.
The various metrics are:
- Response times split in Connect time/Latency/Elapsed time,
- Request size,
- Response size split in Response Headers size and response body size
Warning
The recorded shows timings from your browser, they can be very different from timings of the validations executed from our cloud agents.
Detailed mode
When only one occurrence is available or, the same occurrence is selected in both FIRST and SECOND drop down lists, the detailed mode is activated.
On top of this, you can use the top right menu to perform actions:
| Icon | Action | Description |
|---|---|---|
 |
Enable/Disable auto format | Toggle the content formatting for this box. |
 |
Expand in new window | Opens a new window, giving you more space to work with. |
Tip
You can use the same shortcuts as in code blocks. Check the dedicated page for more info.
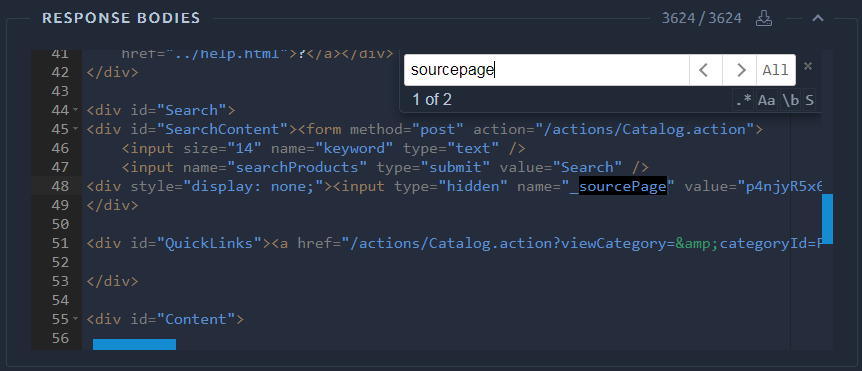
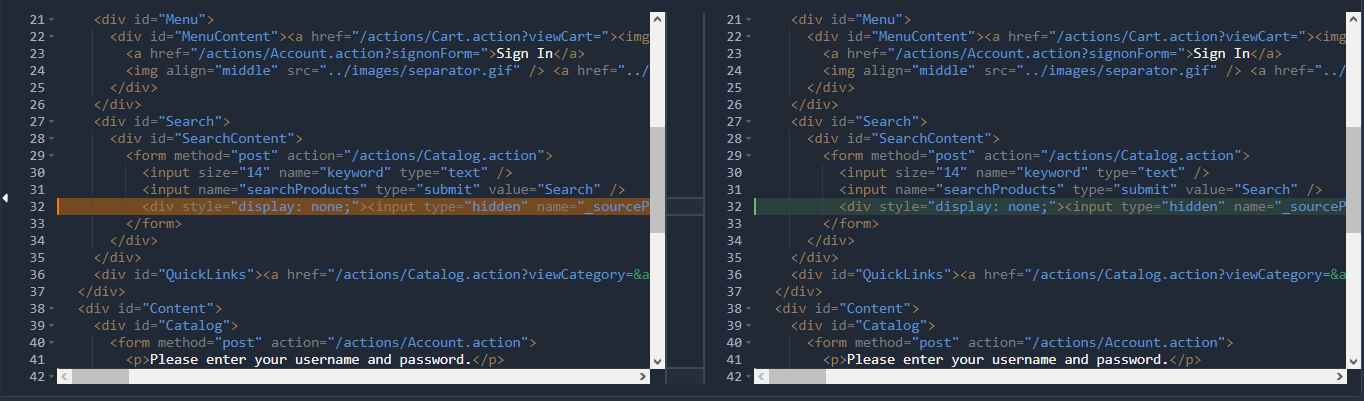
Comparison mode
When a different occurrence is selected in FIRST and SECOND drop down lists, the debug panel switches to comparison mode. In that mode the text editor is slightly less powerful but instead you can use it to compare Headers or bodies across different occurrences.
| Icon | Action | Description |
|---|---|---|
 |
Go to Previous/Next difference | Move through detected differences. |
|
Enable/Disable auto format | Toggle the content formatting for this box. |
 |
Switch comparison mode | Toggle between side by side and in line comparison. |
|
Expand in new window | Opens a new window, giving you more space to work with. |
Tip
You can use the same shortcuts as in code blocks. Check the dedicated page for more info.
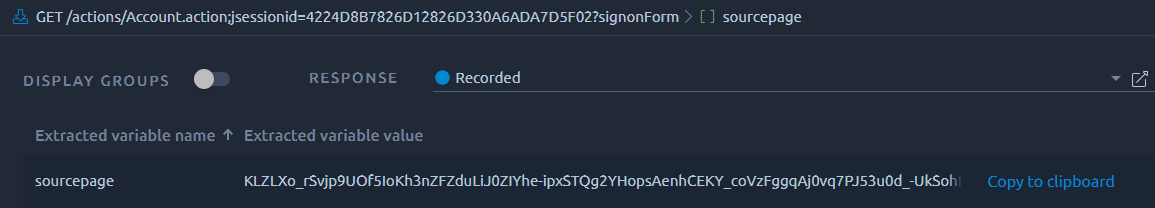
Processor debug
When a Processor like the regex processor is selected, the debug panel will instead display the results of this extractor for the selected response occurrence:
Variable
If your post processor uses a variable, the debug will not work since the value of this variable is not known. But for testing purpose it is possible to specify the value of all variables in the context menu:
Playwright debug
When debugging Playwright virtual users, the debug panel is completely different, check the Playwright Action page for more information.