PostgreSQL

PostgreSQL is a sophisticated open-source Object-Relational DBMS supporting almost all SQL constructs, including sub-selects, transactions, and user-defined types.
Visualize PostgreSQL performance metrics in real-time during load tests. OctoPerf lets you visualize and analyze advanced metrics for your PostgreSQL databases:
- Capture and analyze PostgreSQL metrics and statistics,
- Correlate PostgreSQL metrics with your other systems,
- Create effective alerts on database throughput, locks, or errors.
PostgreSQL performance issues can be seen on the client side or from resource constraints on the server itself, making it tedious to find the root cause of the issue. OctoPerf collects 30+ key monitoring metrics from your PostgreSQL database.
The PostgreSQL monitoring module ships with pre-selected counters and thresholds.
Supported Versions
OctoPerf supports PostgreSQL version 8 and above.
Configuration

The PostgreSQL monitor can be configured in two different ways. The simple mode suits best for most configurations. The advanced mode is great for specifying advanced connection settings.
The database name is required by no specific database is monitored. This monitor executes SQL queries to get system and status variables. OctoPerf requires an account with authorization:
- to connect to the database,
- and to read and collect global status data and variables.
Simple Configuration
- Hostname: hostname or IP of the PostgreSQL database,
- Port: database connection port, 3306 by default,
- Database: database to connect to.
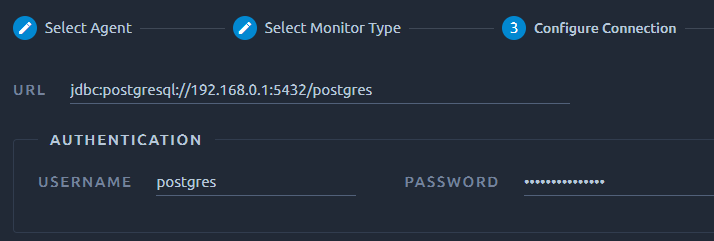
In simple configuration, the JDBC connection url is generated automatically.
Advanced Configuration
- URL: JDBC connection url.
In advanced configuration, a specific JDBC connection URL with extra connection settings to the JDBC driver, such as timeout, cluster handling can be configured.
Credentials
PostgreSQL username and password are required in both simple and advanced configuration.
Monitored Counters
The PostgreSQL monitoring module collects the following metrics:
-
Buffers:
- Buffer Block Reads: Number of buffer block reads per second,
- Buffer Index Block Reads: Number of Buffer index block reads per second,
- Buffer Sequence Block Reads: Number of buffer sequence block reads per second,
- % Buffer Index Block Reads: Percent of buffer index block reads per second.
-
Commands:
- Rows Returned: Number of rows returned by queries in this database per second,
- Rows Fetched: Number of rows fetched by queries in this database per second,
- Rows Inserted: Number of rows inserted by queries in this database per second,
- Rows Updated: Number of rows updated by queries in this database per second,
- Rows Deleted: Number of rows deleted by queries in this database per second,
- Commited Transactions: Number of commited transactions this database per second,
- Rolled back Transactions: Number of rolled back transactions per second,
- % Rolled back Transactions: Percent of rolled back transactions per second.
-
Connections:
- Open Connections: Number of currently open connections,
- Executing Connections: Number of connections currently executing queries,
- Idle Connections: Number of connections currently idle (not executing any query),
- Max Connections: Max number of connections that can be open,
- % Used Connections: Percent of connections being currently used (open / max * 100).
-
Disks:
- Disk Block Reads: Number of blocks directly read on disk per second. For optimal performance this value should be the smallest possible. If the database has to execute too many disk accesses, performance will suffer,
- Disk Index Block Reads: Number of index blocks directly read on disk per second,
- Sequence Disk Block Reads: Number of sequence blocks directly read on disk per second,
- % Index Block Reads: Percent of index block reads (index / (index + disk) * 100).
-
Description:
- Postgres Version: PostgreSQL database version.
-
Indexes:
- Index Reads: Number of live rows fetched by sequential scans per second,
- Index Fetches: Number of live rows fetched by index scans,
- Index Scans: Number of index scans initiated on database per second.
-
Locks:
- Locks Waiting: Number of locks currently waiting to be acquired by running processes,
- Locks Held: Number of locks currently held by processes,
- Processes holding locks: Number of processes currently holding locks.
-
Memory:
- Shared Buffer Size: The shared_buffers configuration parameter determines how much memory is dedicated to PostgreSQL to use for caching data,
- Disk Cache Size: An estimate of how much memory is available for disk caching by the operating system and within the database itself,
- Temp Buffer Size: A session will allocate temporary buffers as needed up to the limit given by temp_buffers,
- Sort Mem Size: Memory size allocated to queries using SORT.