Agent monitoring

Every load generator running during your test is automatically monitored. You can get the metrics from any line chart or by using one of the shorcuts inside the monitoring section.
Warning
Activating IP Spoofing from one of your on premise load generators will deactivate the agent monitoring because of the changes made to networking.
Operating system monitoring
Available counters
The list of available counters on the Linux host and their alert levels is as follows:
- CPU:
- % CPU Usage: % of CPU used: (100 - CPU Idle),
- Load average:
- Load avg per CPU (1 min): Load avg (1 min) divided by number of CPU,
- Memory:
- % Used Memory: % Effectively Used memory: (used - (buffered + cached) / total * 100).
- Network:
- Received MB/sec: Number of MegaBytes per second received,
- Sent MB/sec: Number of MegaBytes per second sent,
- Established connections: Number of established connections.
- TCP:
- % Segments Retransmitted: Percent of TCP segments retransmitted.
Alerts
% CPU Usage
An alert on CPU usage can have several explanations but what's for sure is that once CPU is high, the response times stop being accurate. This is because the underlying JMeter knows how to remove the time spent computing results from the response times, but once this process is slowed down a part of the computing time will sneak into the response time. This can be quite invisible while the CPU is not completely overloaded, but once you reach something like this it will become obvious:

The first and most common explanation is because the test generates too much requests for a single load generators. We usually recommend to run around 1000 hits/sec on a 4-8 CPU load generator. It is possible to run more if you optimize your tests well, typically by avoiding resource-hungry features like:
- Automatic download of resources (consider using static calls to these resources instead),
- Lots of post processors,
- Excessive logging,
- JSR223 Scripts, especially non-groovy scripts that are not cache-compiled.
This happens a lot when you're testing without any pacing or think time. In these situations, the load generator will try to generate as many requests as he can be can quickly run out of CPU in that process. Which is why it is critical to first assess the rate at which you can safely generate load before increasing it.
A good practice in this situation is to start with 1 load generator, on OctoPerf SaaS platform it means 1000 concurrent users. But if you're using your own agents, make sure to check the provider configuration page. Then you can assess how many hits/sec/virtual user you can generate that way. If you have no idea where to start, a good assumption is to go for 1 hit/sec for each virtual user.
Warning
CPU alerts can also be triggered in case the JVM is out of heap space, make sure to check the section dedicated to heap alerts if you also have those.
Load average
The load average is a measure of the amount of work queued in the system. Typically on Linux systems like the one used by OctoPerf 1 unit of load is 1 process waiting to have access to the CPU. A consequence of this is that load average can only be properly measured against the number of CPU cores available. For example a load average of 10 on a single core system means there's a lot of queuing going on, whereas on a 16 core system it might just be business as usual.
A second important concept is that as processes come and go quickly, it is always measured as an average over a period of time. Comparing the 1 min average with the 5 minutes average will give perspective on how things are evolving. A 1 minute avg higher than the 5 minute avg means it is getting worse.

Most of the time load average is below 1 per CPU/Core and all is well, but if it starts increasing over this value it means the CPU has a lot of processes waiting. This can be explained by several factors:
- CPU Usage is high, in which case you should refer to the previous section for more details
- Other operations are slowing down processes to the point that they cannot perform and thus have to wait in queue. A high Load average with low CPU usage is usually a strong sign of I/O issues. In this case you should look for:
- Excessive logging that generates lots of disk I/O,
- Network issues (check the section on segments retransmission for more details).
% Used Memory
When using OctoPerf cloud load generators, we make sure to provision large servers with enough memory for all your requirements. But even if you run on your own on-premise agents, we do a memory check before launching the test. That way OctoPerf knows how much memory is available to work with. Which is why this alert can only trigger if you are using an on-premise agent that is also used by other programs.
An alert on available memory indicates that memory available on the machine has decreased since the test started. Since OctoPerf plans memory usage in advance this can only be explained by another program using the same machine. For this reason it is recommended to install OctoPerf load generators on dedicated machines.
% Segments Retransmitted
This metric indicates the percentage of TCP segments that have been retransmitted. As with most forms of network retransmission, the impact of even a small percentage of TCP segments retransmitted can be huge.
To fully understand this mechanism would require a long explanation and there are a lof of good ones on the web, but it's hardly the place for a course on TCP retransmission.
I think a quick example can be a lot better to understand how this can impact our request response times. Take an HTTP request that weights 100 kB, with the default TCP segment size (536B for IPV4) it will take almost 200 TCP segments to send it over. If only one of these segments gets lost then the server will wait for the agreed upon timeout to ask for retransmission, let's take 1 sec as an example. Then the retransmission has to occur (meaning network latency will be applied once again), so you end up adding more than 1 second to your transaction just because .5% of the packets get lost. A simple request that could have been sent in 100 ms now takes more than 1 second to complete.

Now TCP retransmission mostly occur in case of a network contention. On OctoPerf's cloud load generators we make sure to use large instances with up to 10 GBps of network capacity. Thanks to this, network is never an issue with the load generators except in very particular situations where you download a very large file or test a streaming service.
When traversing various network component with different throughput capacity, it can be difficult to find out which one causes the issue. It is also important to list all the involved parties like firewalls, load balancers or even automatic DDOS protection mechanisms. Adapting the test strategy can help for instance by splitting the load over different regions or by whitelisting one of the load generators and not the other. Installing an on-premise agent close to the servers under test can also allow you to compare different network paths.
JVM monitoring
Available counters
The list of available counters on the Java Virtual Machine running JMeter and their alert levels is as follows:
- JVM:
- Memory:
- % used: Percent used memory (used / max).
- Garbage Collector:
- G1 Young Generation:
- CollectionCount: Number of garbage collections,
- CollectionTime: Time spend in garbage collection.
- G1 Old Generation:
- CollectionCount: Number of garbage collections,
- CollectionTime: Time spend in garbage collection.
- G1 Young Generation:
- Memory:
Alerts
% Heap memory used
The most common issue is with the JVM Heap space. Typically when you run out you would see something like this:

That means the Heap memory allocated for your test was not enough. We already fine tune the JVM and use large cloud instances to avoid most issues but when running a low amount of users or resource intensive scripts, you might need to do one of the following:
- Optimize your virtual users,
- Optimize your JSR223 scripts,
- Increase the memory per user on the runtime screen to higher value,
- Change the memory settings of the on premise provider used.
Be careful not to confuse Heap space issues with CPU issues since an insufficient Heap space will also result in a high CPU usage:
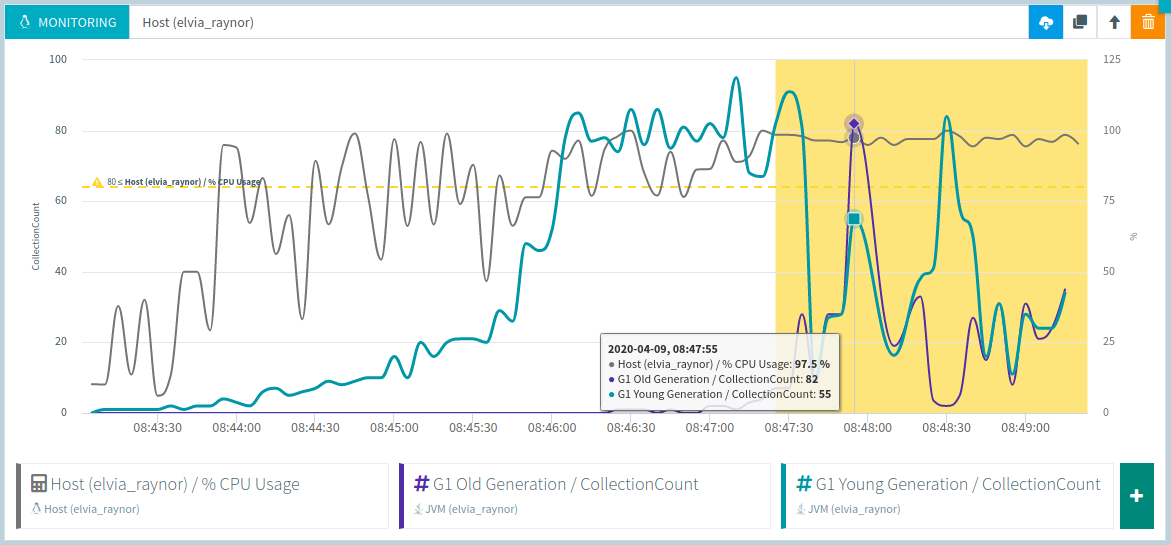
Typically here, whenever the G1 Old generation garbage collection starts, the load generator is quickly out of CPU.