Load
This page lets you define the load profile associated with the select user profile.
A load profile is composed of a number of inflexion points each defined with:
- A time of occurrence,
- A number of concurrent users.
OctoPerf will increase or decrease the load during the test to reach each one of these points.
Warning
If you have defined alternate stopping conditions, the real load may look different than the load profile.
Load chart
Through the various inflexion points, it is possible to directly edit the curve. Note that actions taken here will also reflect in the table below:

| Action | Description |
|---|---|
| Left-click anywhere | Create a new point |
| Left-click on a point | Select a point |
| CTRL + Left-click on a point | Remove this point |
| Drag and drop a selected point | Move the coordinates of a point |
Note
You cannot drag a point before its predecessor or after its successor.
Load table
You can use the table under the graph in order to edit the curve as well:

| Action | Description |
|---|---|
 Add a new point Add a new point |
Create a new point |
 Remove a point Remove a point |
Remove this point |
| Left-click on a line | Select this point |
| Time | Configure the time of this point on the X axis |
| Virtual users | Configure the number of concurrent virtual users of this point on the Y axis |
Rescale
The Rescale button allows you to Rescale the load to a target value while preserving its inflexion points:
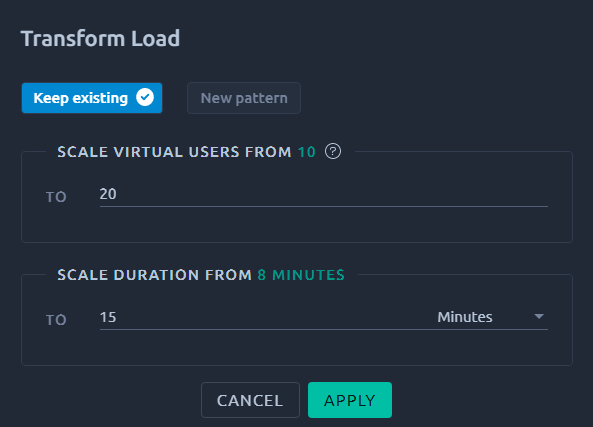
On this screen, you can define a target number for Virtual users and Duration.
When applied, we will increase the size of the load profile to match the new values, exactly like an image that you would enlarge or reduce.
Reshape
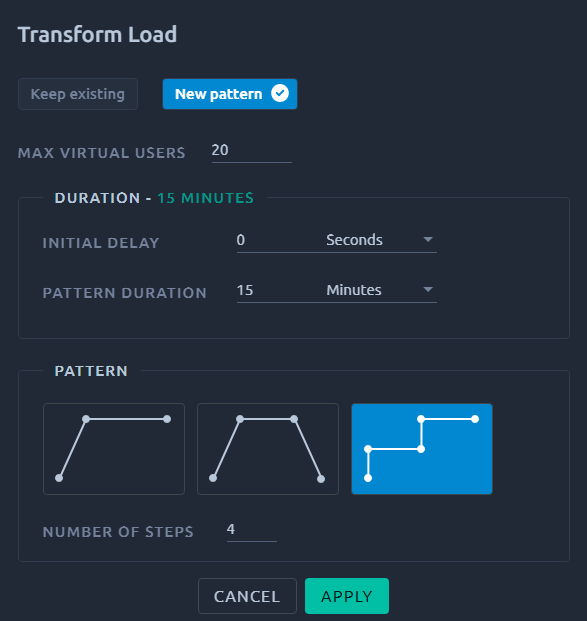
In this menu you can create a brand new load profile from one of our presets.
First you need to define:
| Name | Description |
|---|---|
| Maximum concurrent users | Value of the highest number of concurrent virtual users. |
| Initial Delay | Time before the load starts to ramp up. |
| Maximum Duration | Total duration of the load profile. |
Ramp up
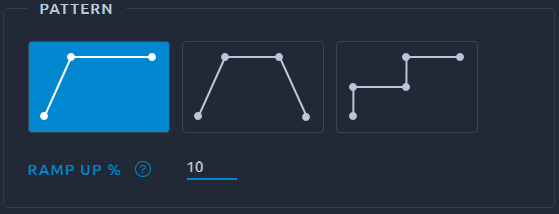
Only one parameter, the percentage of the total time allocated to the ramp up phase. This will define where the inflexion point is placed in the graph.
Ramp up & down
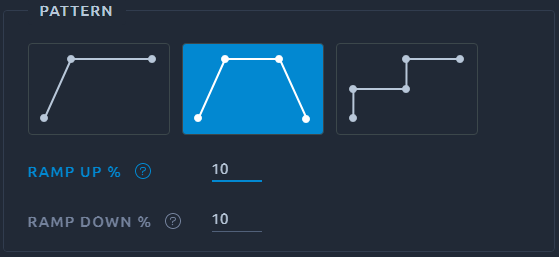
Two parameters here, percentage of total time allocated to ramp up and down. This will define where the inflexion points are placed in the graph.
Steps
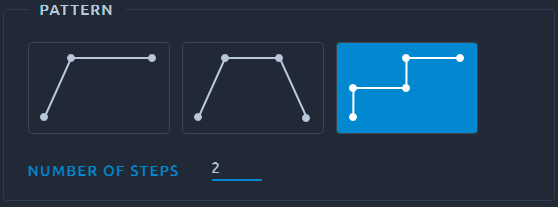
The only parameter is the number of steps, we will then divide the maximum time and concurrent users equally between the number of steps you defined.
WebDriver UserLoad

Real-browser simulation consumes a lot more resources than regular JMeter load tests and when several are executed in parallel the response times may be inaccurate. Since real browsers execute a lot of scripts (usually in JavaScript) and are not meant to be run in parallel they will often compete for available CPU thus increasing scripts execution times.
That is why Webdriver virtual users have their number of concurrent users limited to 1.