Bench Report Configuration
The Bench Report configuration is accessible via the application header in the report edition page. From there you can edit:
- Metadatas,
- Time range,
- APDEX,
- Charts,
- Colors.
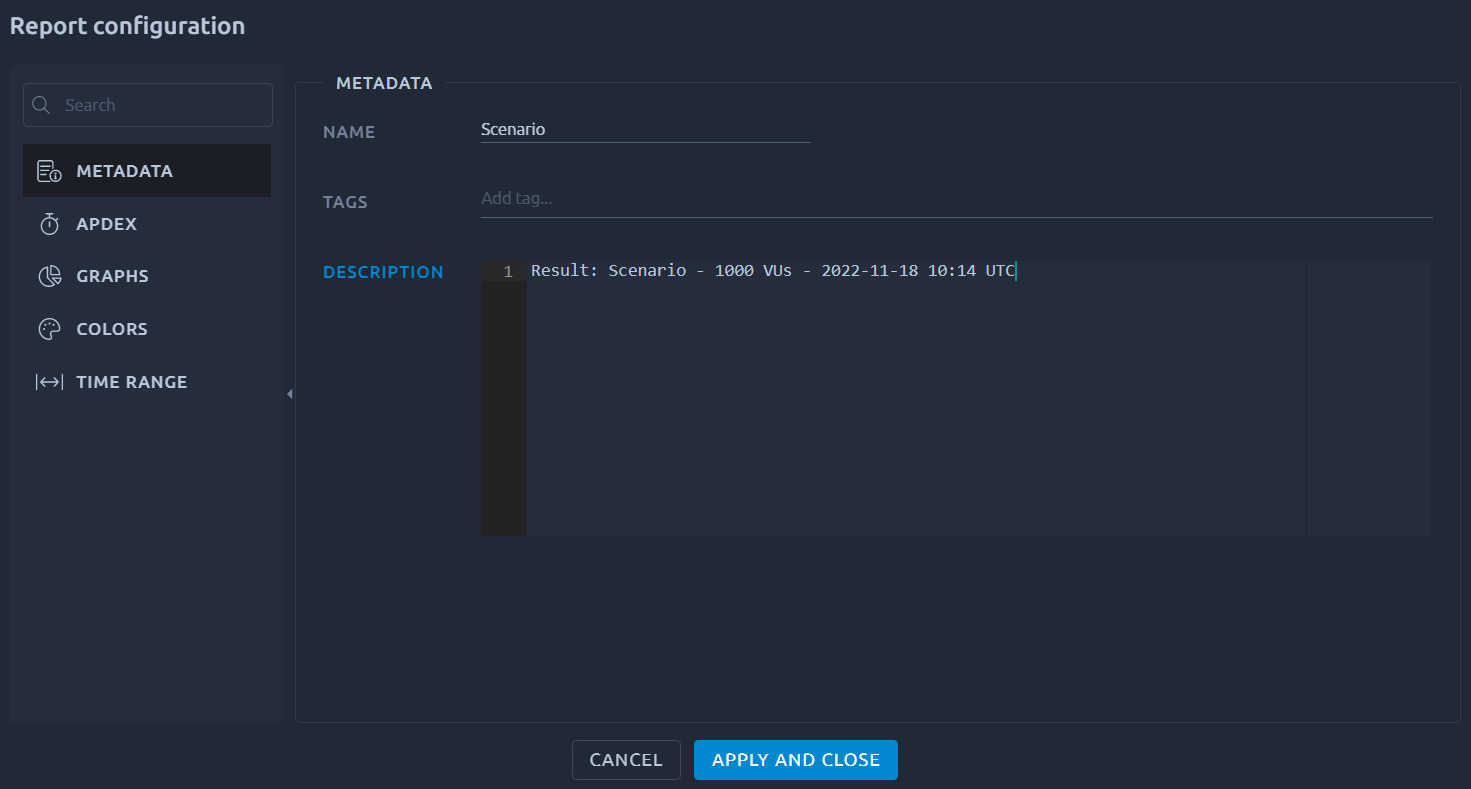
Metadatas
This section allows you to update the report name, description and tags.
Time Range
The time range configuration lets you select the start and end dates for all the items of the current report:

You can adjust the displayed date/time interval by moving the slider bellow the chart or use Reset zoom to clear the filter.
Note
The time range is only available for simple reports (not for comparison report) and only when the test is finished.
APDEX
Apdex (Application Performance Index) defines a standard method for reporting the performance of software applications, by specifying a way to analyze the degree to which measured performance meets user expectations. Score is between 0 and 1, at 1 all users are satisfied.
APDEX satisfying and tolerating response times can be configured globally for the test report:

Click on the Apply button to set the selected satisfying and tolerating values for all APDEX metrics present in the current report. This overrides all specific metric configurations.
Info
APDEX can also be configured for a specific metric. Please refer to the documentation on metrics configuration.
Charts

The Graphs configuration lets you select the maximum number of metrics that can be added to specific report items:
- Max. number of percentiles refers to the legend of Percentiles Report Items,
- Max. number of columns refers to Results Table Report Items and Delta Table Report Items,
- Max. number of pies refers to Donut Chart Report Items,
- Max. number of statistics refers to Statistics Report Items,
- Max. number of lines refers to Line Chart Report Items.
Note
If a report item already has more metrics than what you configure here, the exceeding metrics will not be removed when saving the Graphs configuration. You simply will not be able to add more metrics.
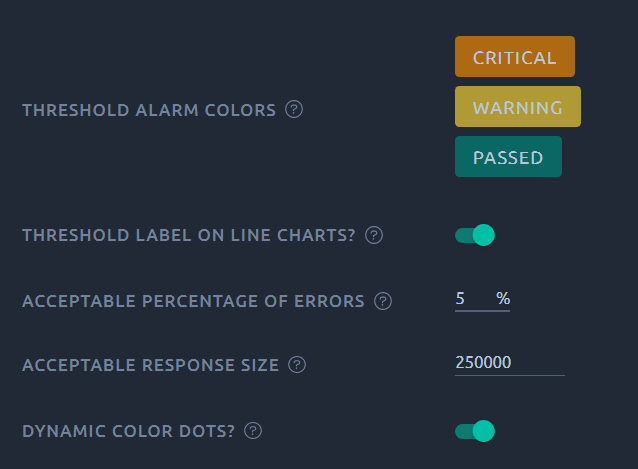
The threshold alarms configuration lets you change the color of the alarms in every line chart and the visibility of the threshold horizontal line labels.
The Acceptable percentage of errors and the Acceptable response size allows you to customize the color dots displayed on certain metrics like % Errors and Response Size.
You can also completely deactivate these dots with the Display dynamic color dots on metrics when available? toggle button.
Warning
You must click on the Apply button to save the Graphs configuration and apply it to the current report.
Colors
The colors configuration simply lets you select the color for each metric unit. These colors are used to display lines in charts or columns in tables.

You may select multiple colors for each unit. And the color used will depend on the metric index in the legend.
Warning
You must click on the Apply button to save the Colors configuration and apply it to the current report.