The Monitoring Page
The Monitoring page allows you to manage Monitoring connections. Each one of these connections will gather metrics from a your servers while OctoPerf tests are running.
Tip
In order to use OctoPerf monitoring you have to install an OctoPerf On premise Agent.
Monitor connections
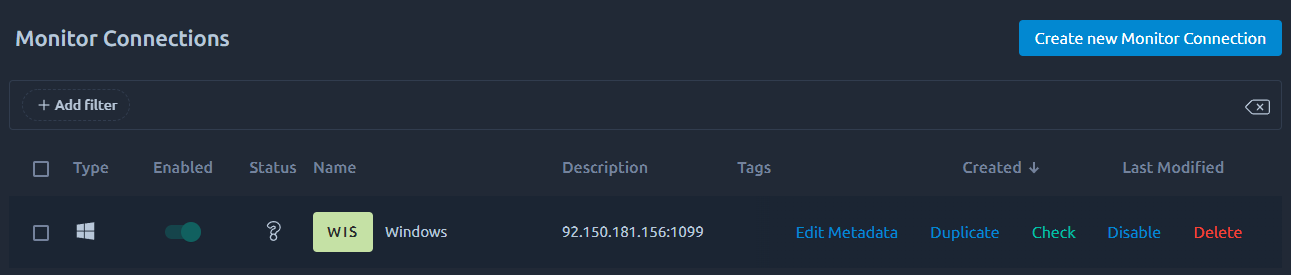
This page lists all the existing monitoring connections. The list features all the usual possibilities as described in the dedicated section about lists.
On top of that, when you hover or select monitoring connections you can perform the following contextual actions:
- Edit metadata: Update Name/Tags/description,
- Duplicate: Create a copy of selected items,
- Check: Run a test monitoring to confirm it still works,
- Enable/Disable: Disabling a monitoring connection allows you to run a test even if this monitoring doesn't work.
New monitor connection
Select agent
Agent selection screen
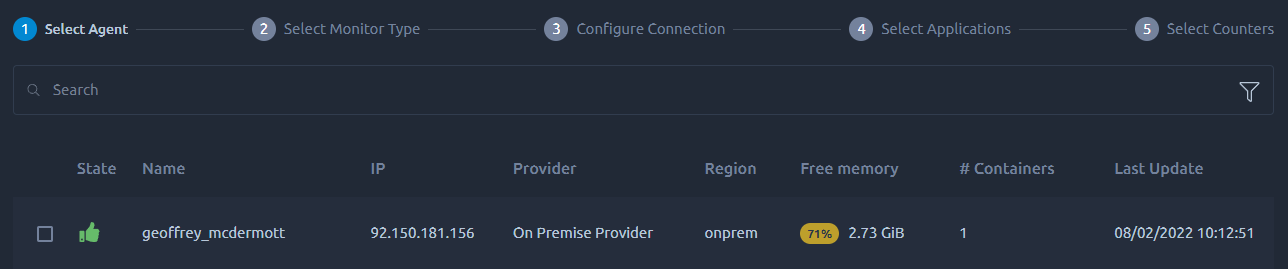
First you need to select the agent that will make the connection to your monitored servers. If the list is empty, make sure to install an OctoPerf On premise Agent first.
Warning
Make sure the agent you selected has a valid network path to your monitored servers and that the ports are opened.
Docker Agent
![]()
Octoperf's monitoring agent is packed into a single docker image. This agent contains all the necessary libraries to connect and monitor your infrastructure. Docker containers are flexible and easy to run.
Note that once created, every monitoring connection will be associated to a particular agent. If you remove or recreate the agent, then the monitoring connection will be orphaned. A simple way to fix this is to edit the monitoring connection and save it. This way the next available agent will be used instead.
If you want to make this process automatic, you need to ensure that when you recreate the agent he gets the exact same ID. That can be achieved by overriding the agentId manually:
-
Create an
agentId.txtfile on the host, -
Put a random uuid inside it,
-
Add it to the container through a volume:
-v ./agentId.txt:/home/octoperf/agentId.txt
Warning
Make sure the agentId.txt file doesn't contain any new line or special char otherwise they will be picked as part of the agentId and create unpredictable behavior.
Select monitor type
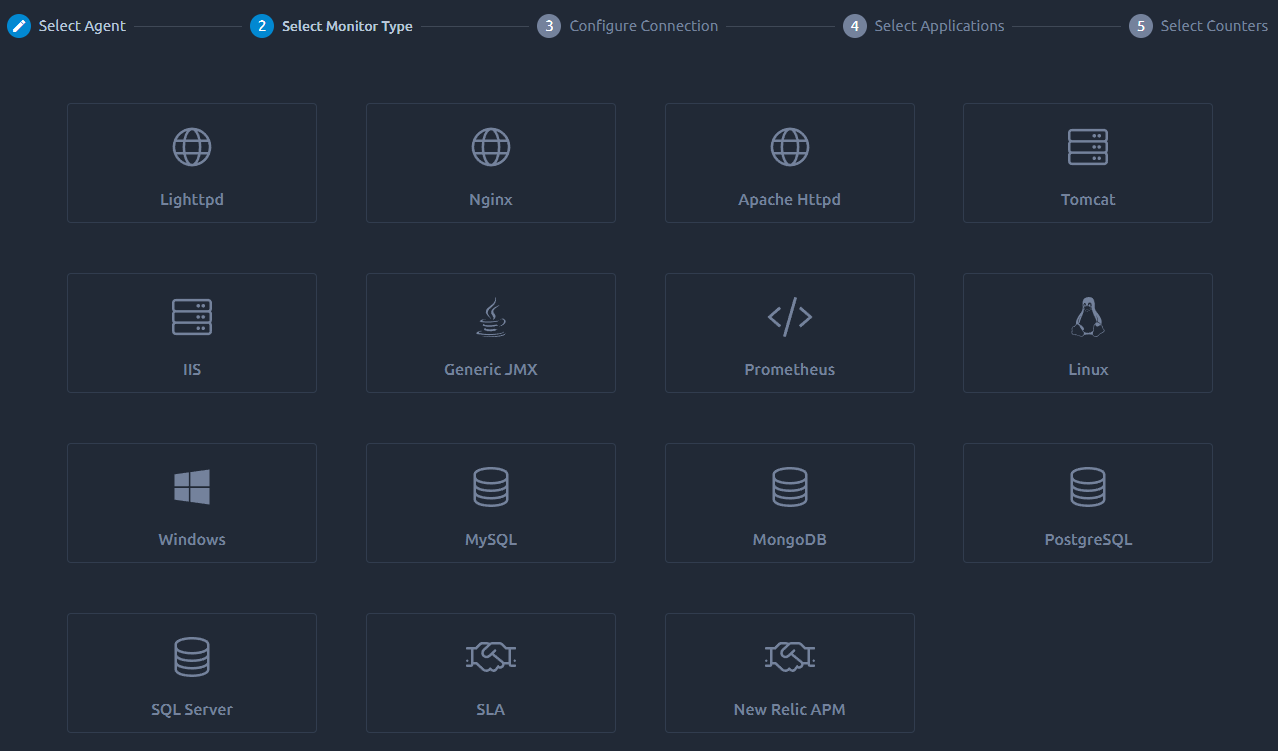
Select the monitor you want to create in this list.
Configure connection
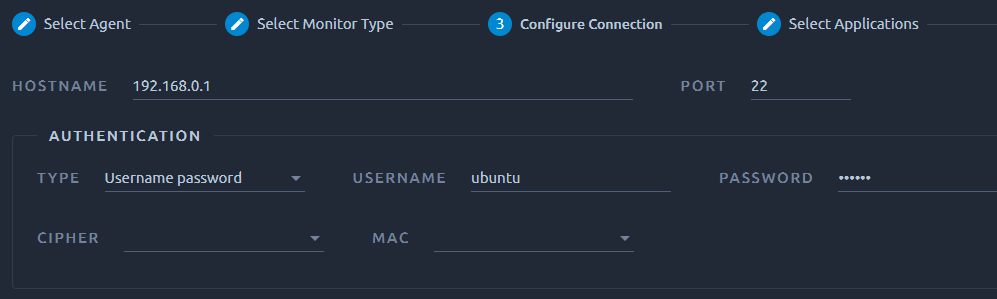
The info required on this screen depends on the type of connection you want to create:
- Operating systems
- Web Servers
- Application Servers
- Databases
- Service Level Agreement
Applications Selection

Applications are groups of counters that have to be preselected in advance, typically in the above example, before you pick individual counters for a process, you have to first select that process. In another context, on a tomcat server you could select one or several distinct web applications to be monitored and then proceed to select individual counters for each one of them.
Select counters

Each monitoring module provides numerous counters and metrics which can be collected. Selecting the right counters can be a tedious and time consuming task, especially if you don't have expertise in that domain.
Each monitoring module pre-selects most relevant counters. The counter selection can be customized to meet advanced user needs.
Warning
Make sure to select all the relevant counters before creating the monitoring connection. It is not possible to update the list of metrics afterwards.
Counters types
Regular counters
Most counters will contain the raw value provided by the third party system used to monitor. We do not rework these values in any way.

In this example we used perfmon on windows to get the available MBytes.
Computed counters
Some counters are computed using values from multiple other counters such as percentage, substractions or per second conversions. Monitored servers are often exposing raw metrics which need to be reworked before being easily understandable.

For example here the percentage of TCP retransmission is computed from the number of packets retransmitted versus the total number of packets.
Textual counters
Textual counters provide information like database version, JVM version, thread pool configuration etc. It is unlikely that they will change during a test, but their value can be of interest to keep track of configuration changes.

Predefined Thresholds

Each monitoring module ships with pre-defined thresholds. Thresholds raise alerts depending on the value of the counter and how many times it reached the threshold. Threshold allow to quickly pinpoint issues on backend by concentrating on failing counter metrics.
Thresholds can be customized to specific needs and set on any counter using the edit connection screen. Each monitoring module ships with pre-defined thresholds coming from known industry standards.
Warning
If you get error messages like timeouts or cannot see the list of counters, consider our agent troubleshooting guide.