> OctoPerf's load testing - Report Item Export documentation page. How to export charts and table as .png images or CSV files.
Source: https://api.octoperf.com/doc/analysis/export-bench-report/export-report-items/
# Exporting report items
{ align=left }
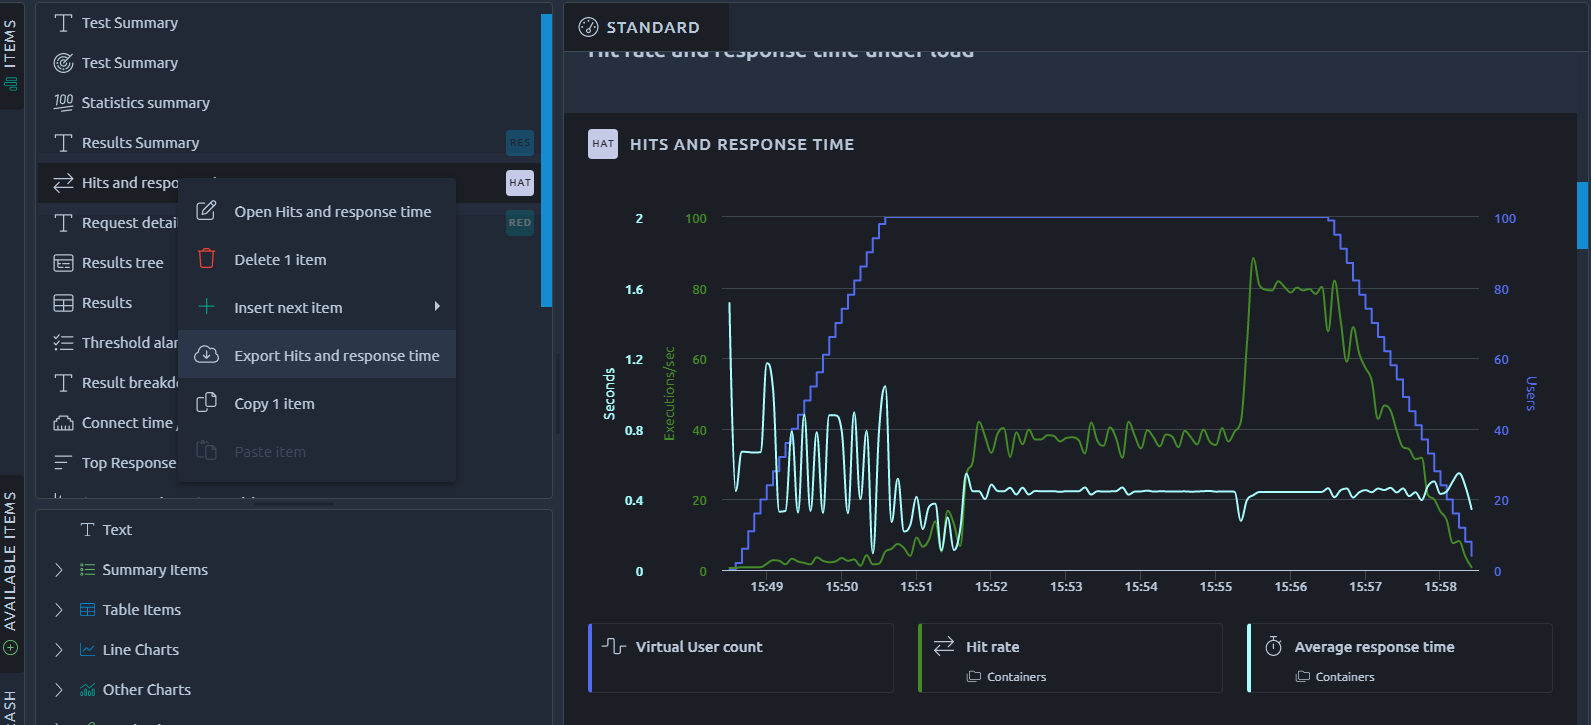
*Bench Report Items* can be exported anytime using the _Export_ option in the [right click menu](https://api.octoperf.com/doc/analysis/edit-bench-report/#items-list):
If you prefer to export the whole report at once, please refer to the [Exporting a Bench Report documentation page](https://api.octoperf.com/doc/analysis/export-bench-report/).
## Exporting tables
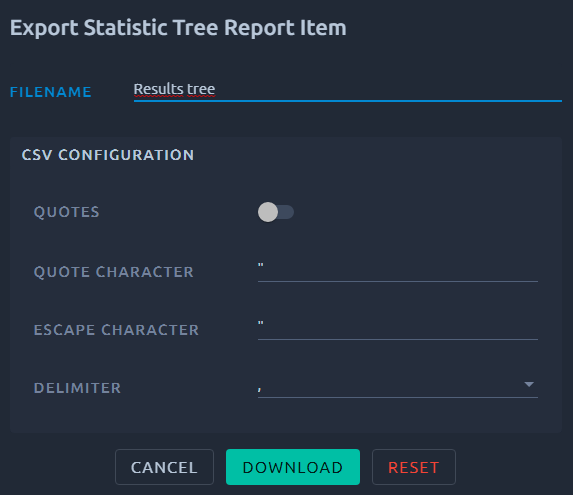
Table report items like statistics tables, delta tables or errors tables can be exported as CSV files. To that end, you can choose the delimiter and a few other options:
!!! note
Some tables may contain timestamps that will not properly render in Microsoft excel, you can fix this by using a formula to format the date in excel-compatible date format:
```
=(A2/86400000)+DATE(1970,1,1)
```
You can then format the resulting column as a date and pick your date format to get exactly what you want.
## Exporting charts
{ align=left }
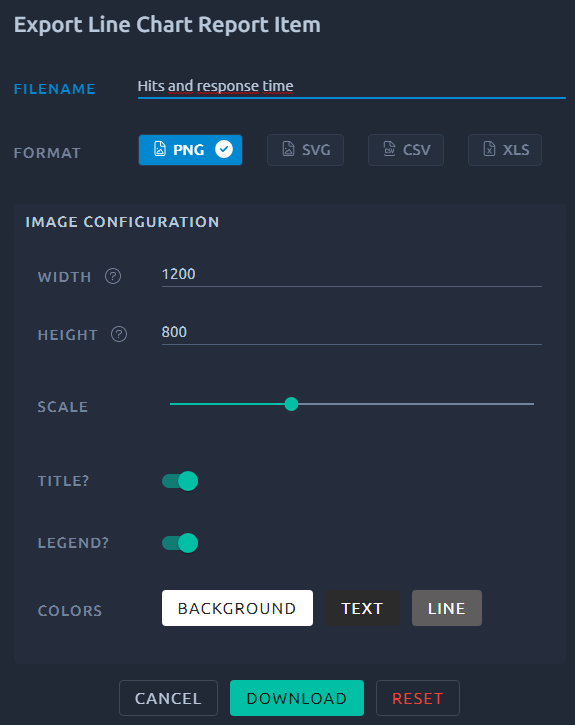
All graphical report items like line charts, percentiles or pie chart can be exported as images or CSV files. The export screen offers various configuration options depending on what you want to export exactly.