> OctoPerf's load testing - Results Tree Report Item documentation page. Results Tree Report Item edition and usage.
Source: https://api.octoperf.com/doc/analysis/edit-bench-report/report-items/results-tree/
# Results Tree Report Item
The results tree provides overall statistics for each container or request in the form of a tree.
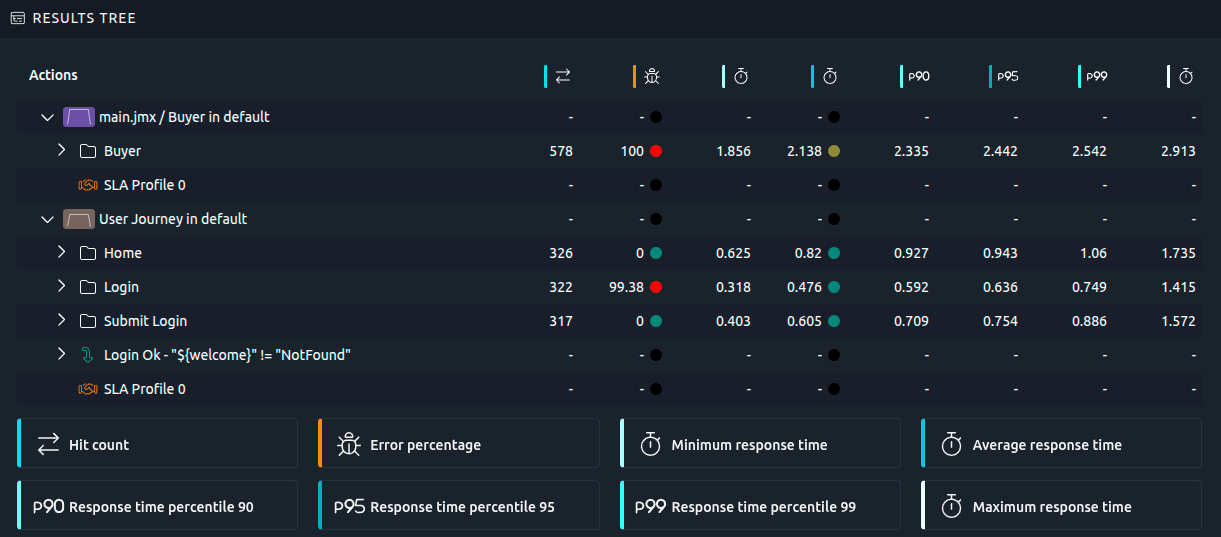
Several metrics are available, please report to the [Hit Metrics Availability](https://api.octoperf.com/doc/analysis/edit-bench-report/performance-metrics/#hit-metrics-availability) tree.
!!! note
To customize a specific column, please refer to the documentation page about the [legend and metrics](https://api.octoperf.com/doc/analysis/edit-bench-report/metrics-selection/).
!!! info
When displaying statistics for HTTP requests, you may have two rows for each request if you selected [_Download Resources_ in your Virtual User](https://api.octoperf.com/doc/design/edit-virtual-user/action-types/http-actions/#download-resources).
* A row that displays statistics for the HTTP request itself:  * A row that displays statistics for all the HTTP request resources (Images, scripts, CSS files, etc.):
 ## Virtual Users and user profiles
The tree holds **one root per Virtual User**, whatever the number of user profiles that play it in your scenario. A Virtual User your scenario runs from ten different locations therefore appears once, and the statistics of its rows cover the whole run.
A Virtual User that also runs as a [Set Up or Tear Down](https://api.octoperf.com/doc/runtime/edit-scenario/edit-user-profile/options/setup-teardown/) phase gets its own root, so what happened before and after the main load never gets mixed with it.
To look at a single user profile, add a **User Profile** filter to the item from the [metrics selection](https://api.octoperf.com/doc/analysis/edit-bench-report/metrics-selection/) page. The values it offers are the user profiles of the scenario, in the order they appear in it.
## Export
To export the table please refer to the [dedicated documentation page](https://api.octoperf.com/doc/analysis/export-bench-report/export-report-items/#exporting-tables).
## Playwright
When working with [Playwright virtual users](https://api.octoperf.com/doc/design/create-virtual-user/import-playwright-node-project/), the tree is slightly different, with two main groups:
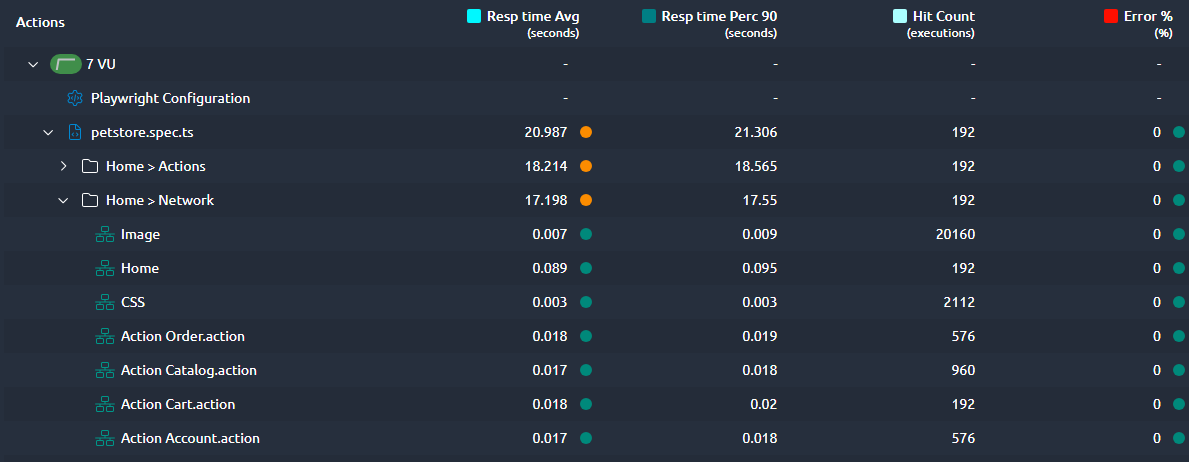
**Actions**: List of all the actions performed inside the Playwright script along with their response time.
**Network**: A measure of the response time of the actual requests performed by your playwright browser. They can be grouped using [Aggregators](https://api.octoperf.com/doc/design/edit-virtual-user/action-types/playwright-actions/playwright-spec-action/#aggregators) from inside your playwright virtual user.
### Known limitations
When a Think Time (slowMo) is used, the response times may display negative values in some corner cases:
* Using discouraged Playwright API like [waitForTimeout](https://playwright.dev/docs/api/class-page#page-wait-for-timeout),
* Using actions inside nested `for` and `if` instructions.